Exploring the Dynamics of BTC/USD: Insights and Projections
Introduction to the Current Bitcoin Market Scenario
Key Takeaways:
- Bitcoin ETFs have launched successfully, drawing significant investor interest.
- The BTC/USD pair shows bullish trends but faces potential corrections.
- Technical and sentiment analyses provide crucial insights for market participants.

In recent developments in the cryptocurrency market, the introduction of Bitcoin ETFs (Exchange Traded Funds) has marked a significant milestone. Contrary to the skepticism of many, these ETFs, including those by BlackRock, Grayscale, and Fidelity, have seen a substantial trading volume, exceeding USD 4.5 billion on their first day. This surge indicates a strong investor appetite for Bitcoin-related products.
Technical Analysis and Market Sentiment
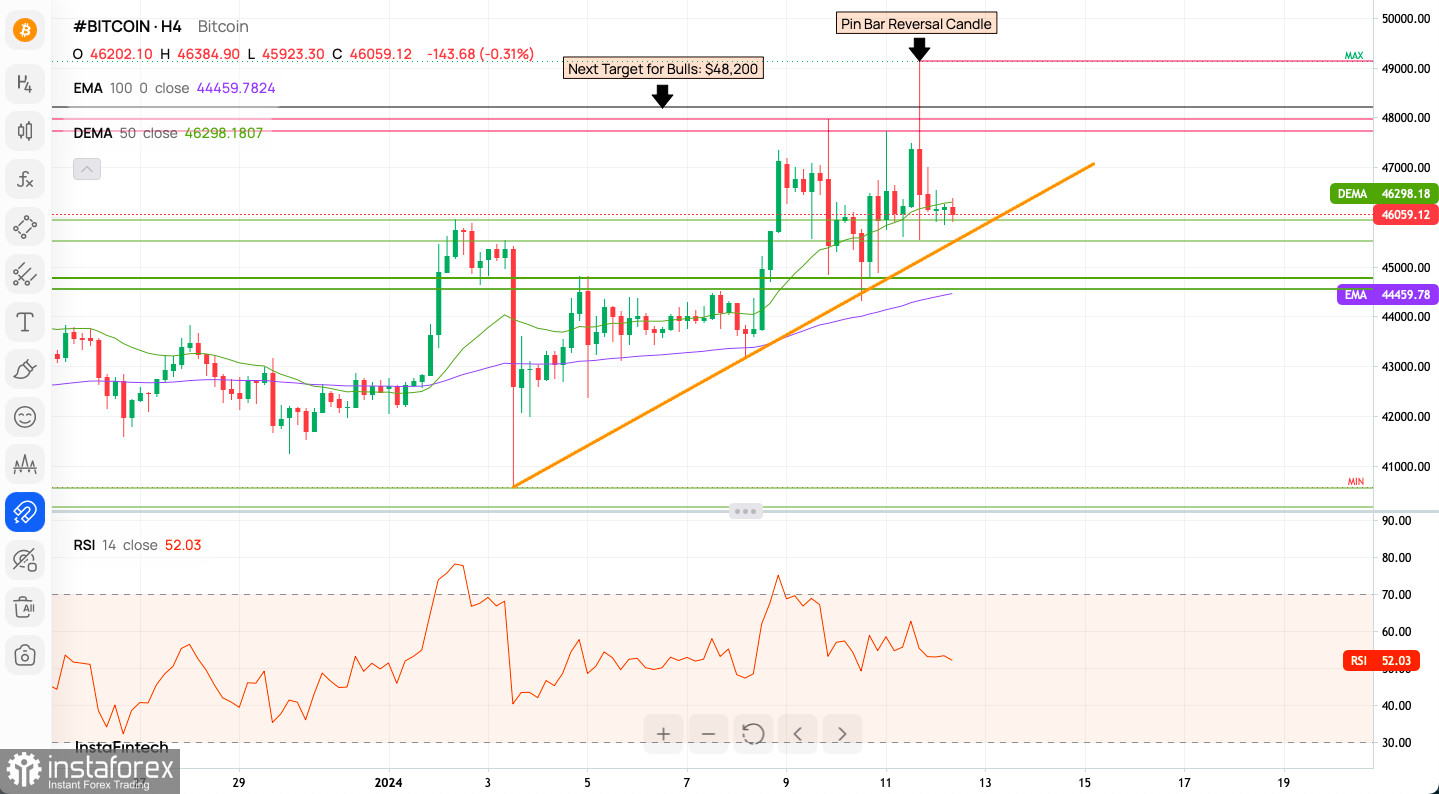
The BTC/USD pair recently achieved a new yearly high of $49,126, demonstrating robust bullish momentum. Despite this, a minor pullback occurred, hinting at the possibility of a short-term corrective phase. The bullish target is set at $50,000, with key support levels identified at $46,000 and $44,740, and resistance at $47,722 and $47,977. This pattern suggests a continuing uptrend, but with potential for temporary retracements.

In terms of sentiment, the market predominantly favors bulls, with a sentiment scoreboard showing 73% bullish versus 27% bearish. This sentiment has remained consistent over the past week and aligns with the general positive outlook in the market.
Weekly Technical Overview and Projections
Weekly pivot points are crucial for traders to understand potential trend reversals. The current pivot points range from a high of $53,656 (WR3) to a low of $33,509 (WS3), indicating significant volatility and potential trading ranges.

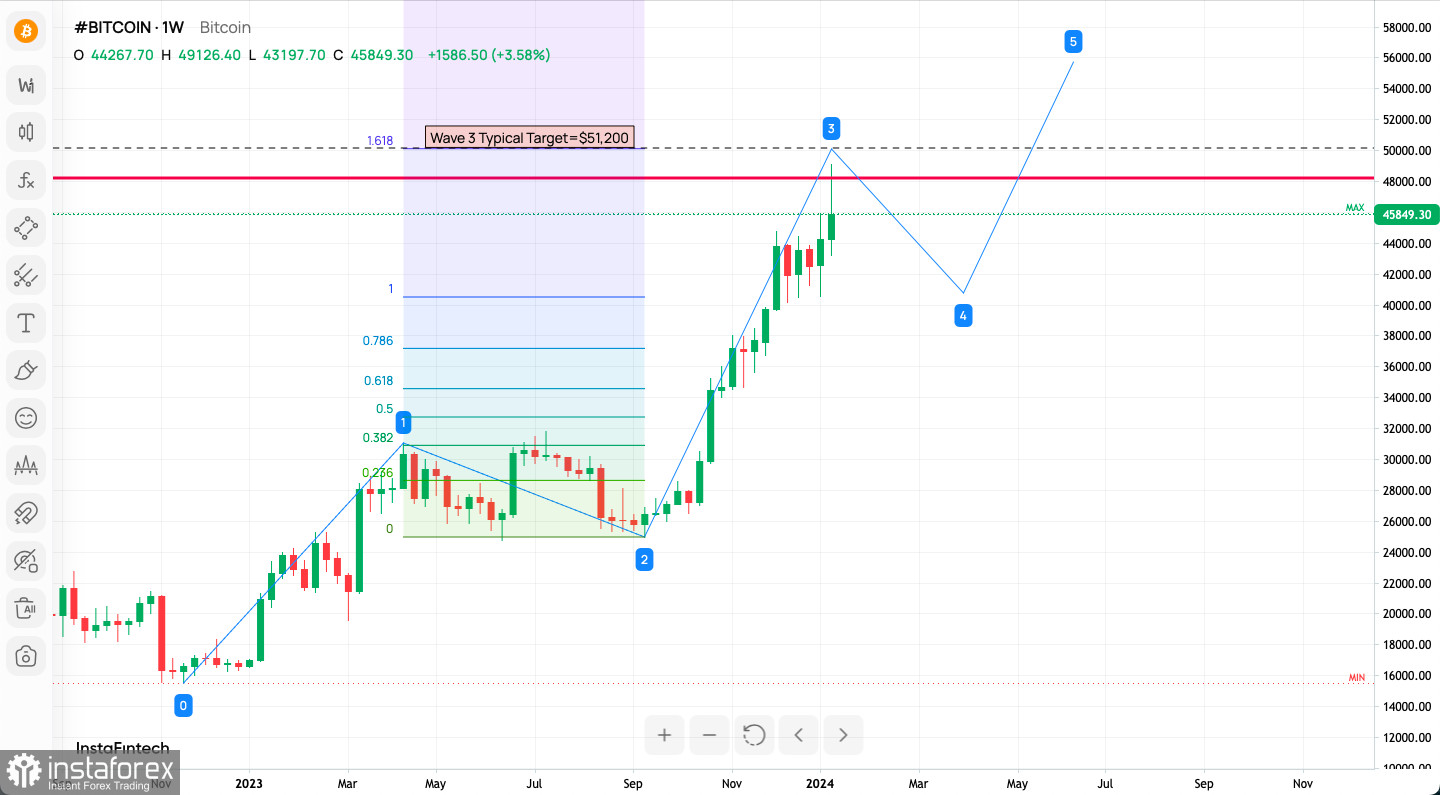
The Elliott Wave projection suggests that Bitcoin is in an expansive third wave, typically the most dynamic and extensive, pointing towards potential further growth. The projection targets the $51,200 level, aligning with Fibonacci extensions. Additionally, recent green candlestick patterns indicate strong buying interest, supporting the bullish trend.
Conclusion: Practical Trading Insights
For bullish traders, maintaining positions above the key support level near the current price is crucial. The potential upside, as indicated by the Elliott Wave projection, targets around $51,200, offering a favorable scenario for growth-focused strategies.
Conversely, bearish traders should be cautious and look for signs of trend reversal or corrective phases, particularly if the price falls below key support levels. The pivot points and moving average indicators provide valuable references for potential entry and exit points.
In conclusion, while the BTC/USD pair exhibits a strong bullish trend, traders must remain vigilant for signs of corrections. The market sentiment, technical indicators, and recent ETF performance provide a comprehensive overview for informed trading decisions. However, it's important to remember that these insights are not trading advice but rather analyses to assist in understanding market dynamics.
Useful Links
Important Notice
The begginers in forex trading need to be very careful when making decisions about entering the market. Before the release of important reports, it is best to stay out of the market to avoid being caught in sharp market fluctuations due to increased volatility. If you decide to trade during the news release, then always place stop orders to minimize losses.
Without placing stop orders, you can very quickly lose your entire deposit, especially if you do not use money management and trade large volumes. For successful trading, you need to have a clear trading plan and stay focues and disciplined. Spontaneous trading decision based on the current market situation is an inherently losing strategy for a scalper or daytrader.


