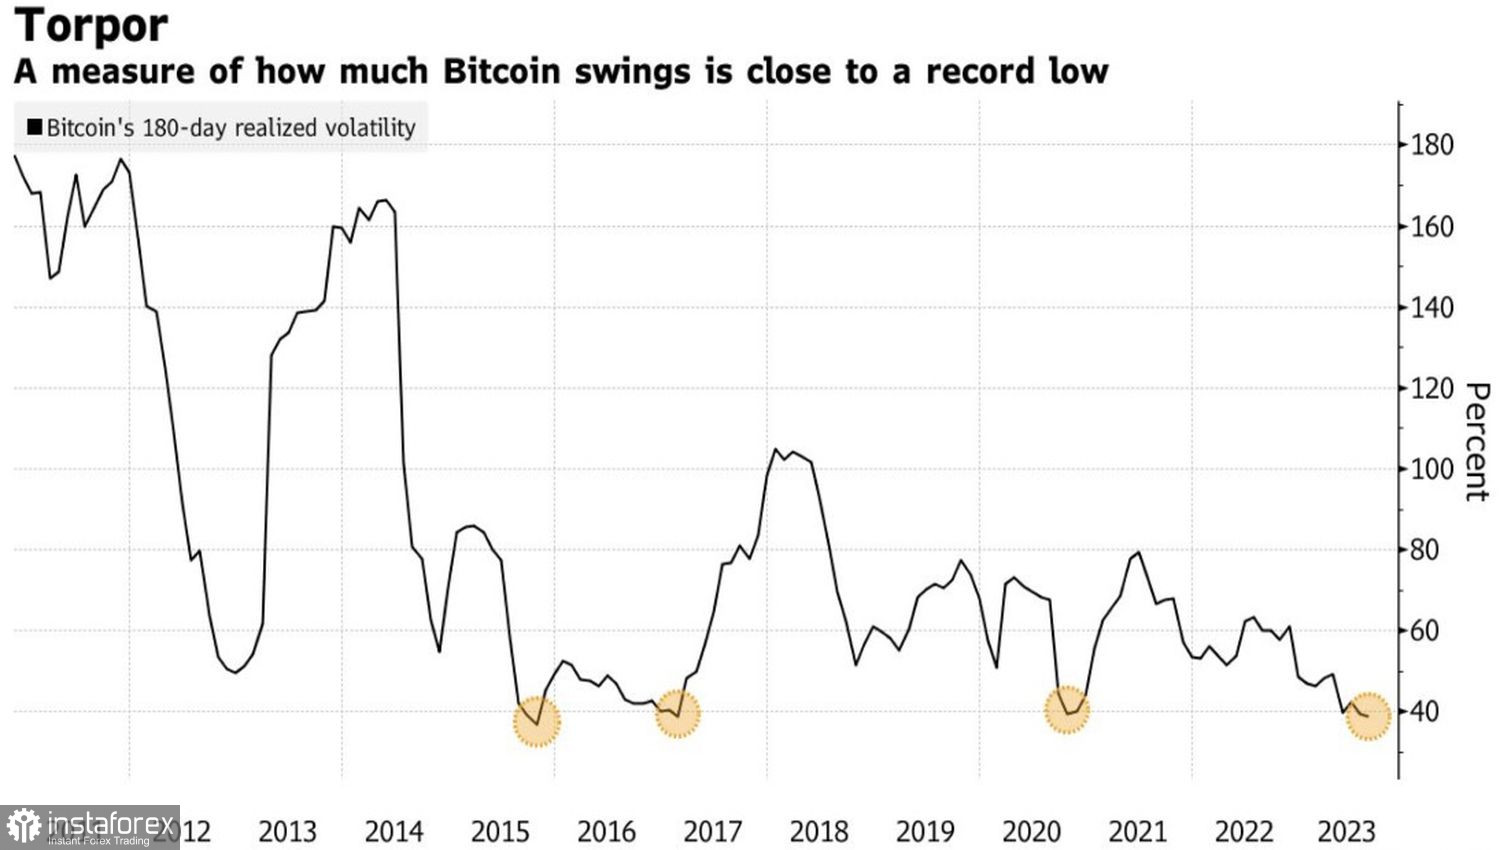
If you want to predict the future, look to the past. Bitcoin's summer slumber has dragged on. Such low monthly volatility, according to Bloomberg research, has only occurred with the cryptocurrency in 2% of cases over the last decade. After 7 and 10 such instances, BTC/USD quotes shot up on average by 16% over the subsequent 30 days. History repeats itself. So, instead of dismissing the asset as dull, one should take a closer look at it.
Bitcoin's Six-Month Volatility Trend

The cryptocurrency market seems frozen in anticipation of the verdict from the Securities and Exchange Commission (SEC). Whether the SEC approves or rejects applications from BlackRock and other large institutional investors to create specialized exchange-traded funds with bitcoin as the underlying asset, BTC/USD volatility is at risk of increasing significantly. A positive decision could lead to a capital influx into the digital assets market. Conversely, a refusal would further deter large players from it.
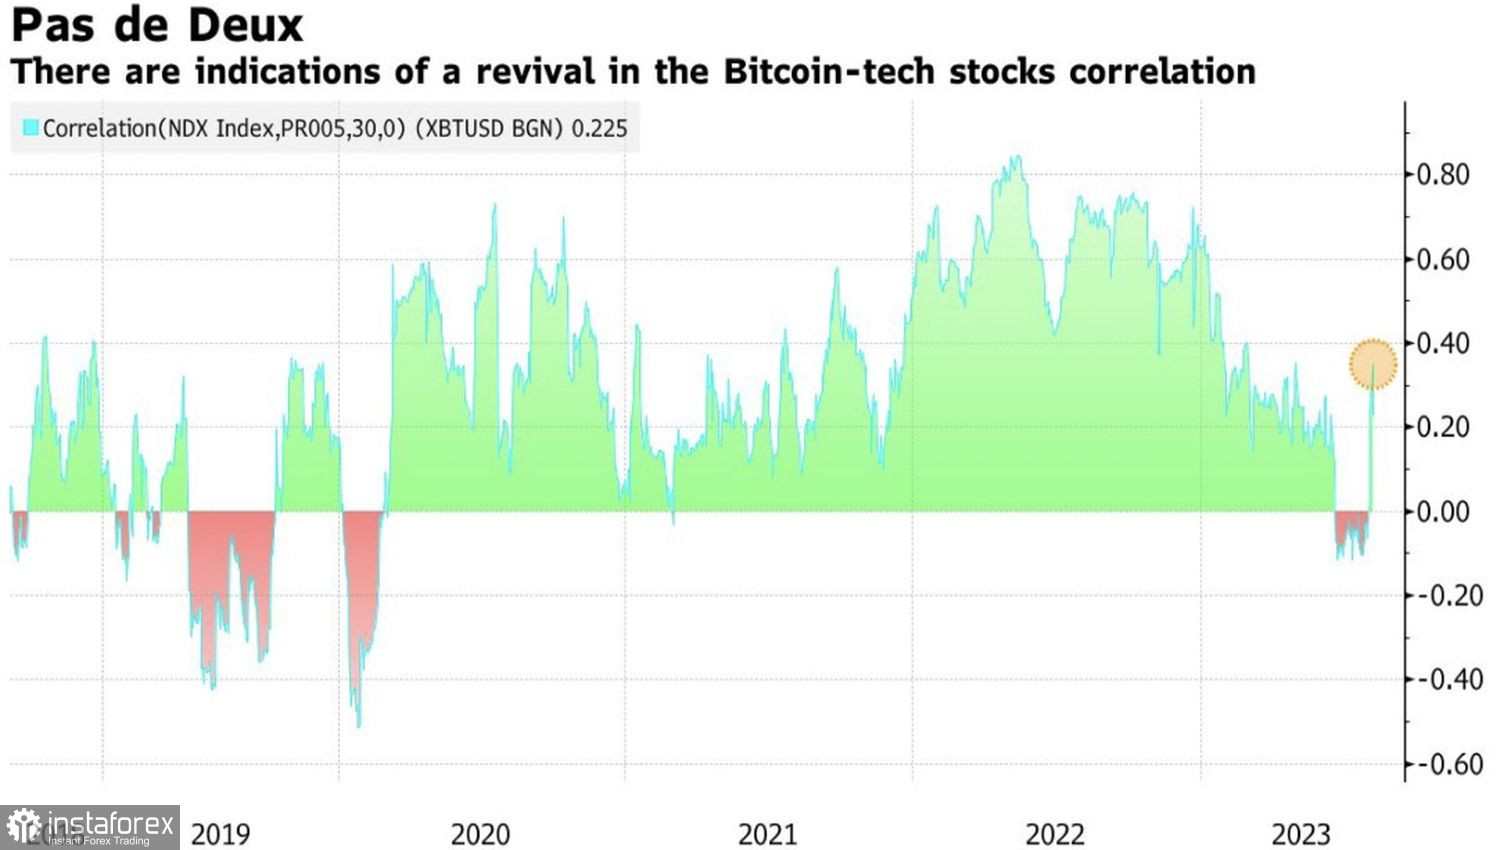
While the regulator's verdict is pending, the cryptocurrency sector leader is trying to find fresh growth-decline drivers and finds them in the U.S. stock market. Thanks to the impressive financial results of Berkshire Hathaway, stock indices soared at the beginning of the week leading up to August 11, but the subsequent downgrade of 10 American banks by Moody's and the rise in Treasury bond yields negated their success. Bitcoin seemed to have copied the S&P 500: it jumped at the start of the five-day period but then returned to dull and dreary consolidation. As a result, its correlation with the stock market began to grow.
Bitcoin's Correlation Dynamics with Nasdaq 100

Despite the fact that the connection between BTC/USD and the class of risky assets is strengthening, it is premature to talk about its full recovery. The cryptocurrency market is awaiting the verdict of the Securities and Exchange Commission, and only after that will it be able to return to full life. In the future, it will fully respond to the state of the global economy, the monetary policy of the Federal Reserve, and the global appetite for risk.

For now, the macroeconomic background includes the nearing end of the Federal Reserve's monetary tightening cycle, the challenging situation of the Eurozone's economy, and China's sluggish recovery. The first factor puts pressure on the U.S. dollar, the other two on its competitors. As a result, there is a consolidation of the USD index, which serves as an additional driver for Bitcoin's tendency to trade within narrow channels.
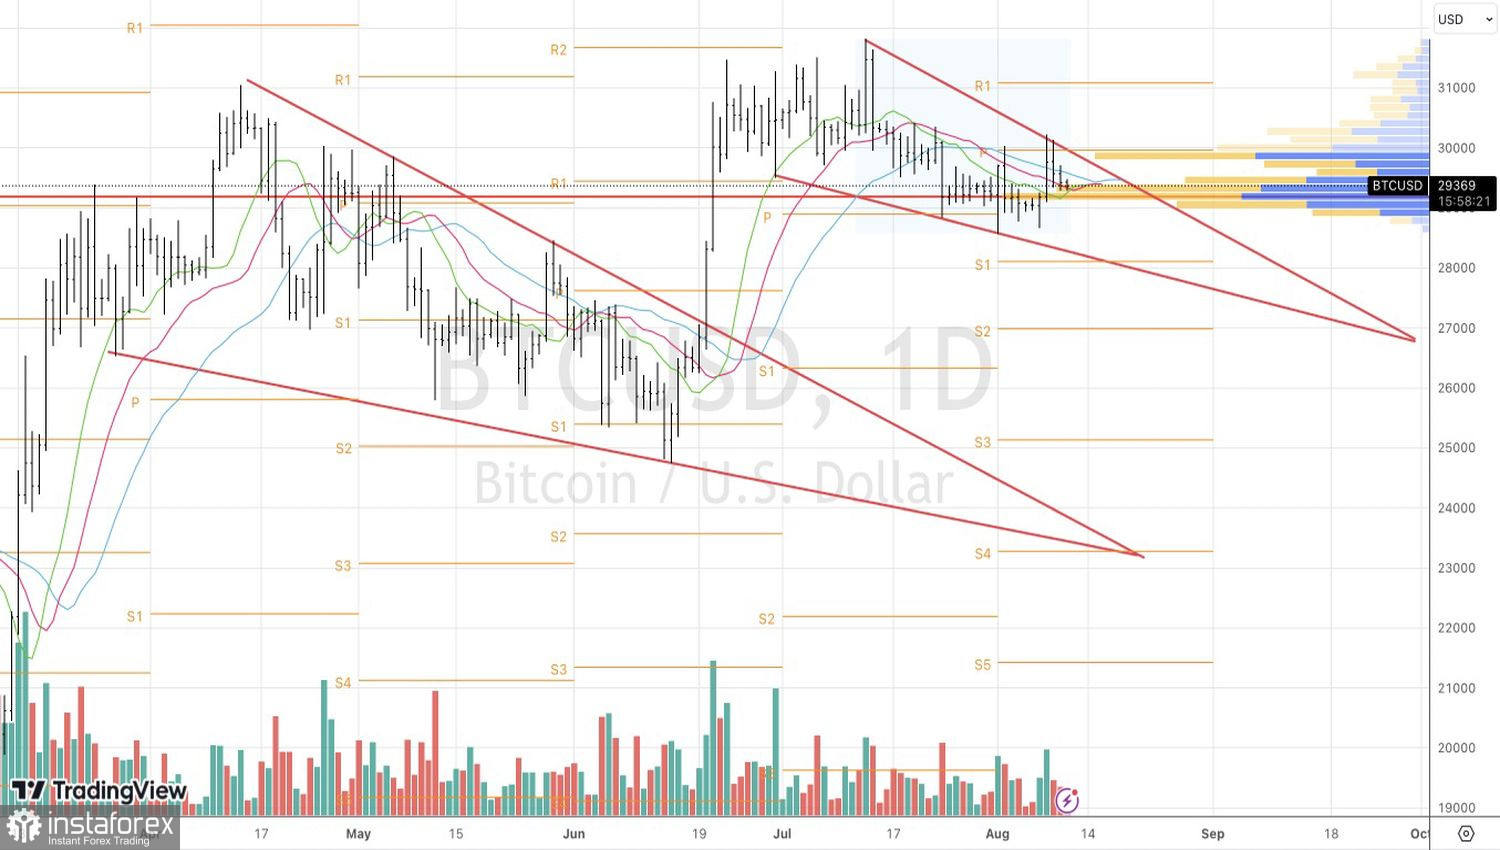
Technically, on the BTC/USD daily chart, the same downward wedge pattern was formed as in March-June. Then it ended with a breakthrough upwards. History may repeat itself, so traders should keep their finger on the pulse. A break of the pivot level at 30,000, where the upper boundary of the wedge is located, will increase the risks of Bitcoin's quotes rising and will be a basis for buying in the direction of 31,000 and 33,000. Until this happens, it makes sense to switch from short-term shorts to longs on a rebound from support at 28,000.


