Forex Market Analysis: A Deep Dive into EUR/USD Dynamics
Global Financial Landscape: A Snapshot of the Day
Today's global financial scene is marked by European indices showing gains and a keen focus on inflation reports from Europe. Interestingly, the US markets and banks take a pause for the Martin Luther King Jr. Day holiday. This situation sets a unique stage for forex and stock markets, with no major publications poised to sway the markets today.

Europe's Economic Pulse: Inflation Figures in the Spotlight
The day's spotlight shines on Europe, where inflation data from Poland, Sweden, and Croatia will be released. All eyes are on these numbers, anticipated to be lower, painting a critical picture of the current economic health in these countries.
Detailed daily calendar:
11:00, Euro Zone - industrial production for November:
Industrial production: forecast -5.9% y/y; previously -6.6% y/y;
Industrial production: forecast -0.3% m/m; previously -0.7% m/m;
11:00, Euro Zone - trade balance for November:
Trade balance: forecast 11.2B; previously 11.1B;
14:30, Canada - Industrial sales:
forecast 1.0% m/m; previously -2.8% m/m;
14:30, Canada - Wholesale sales for November:
forecast 0.8% m/m; previously -0.5% m/m;
Technical Analysis: EUR/USD Trading Patterns
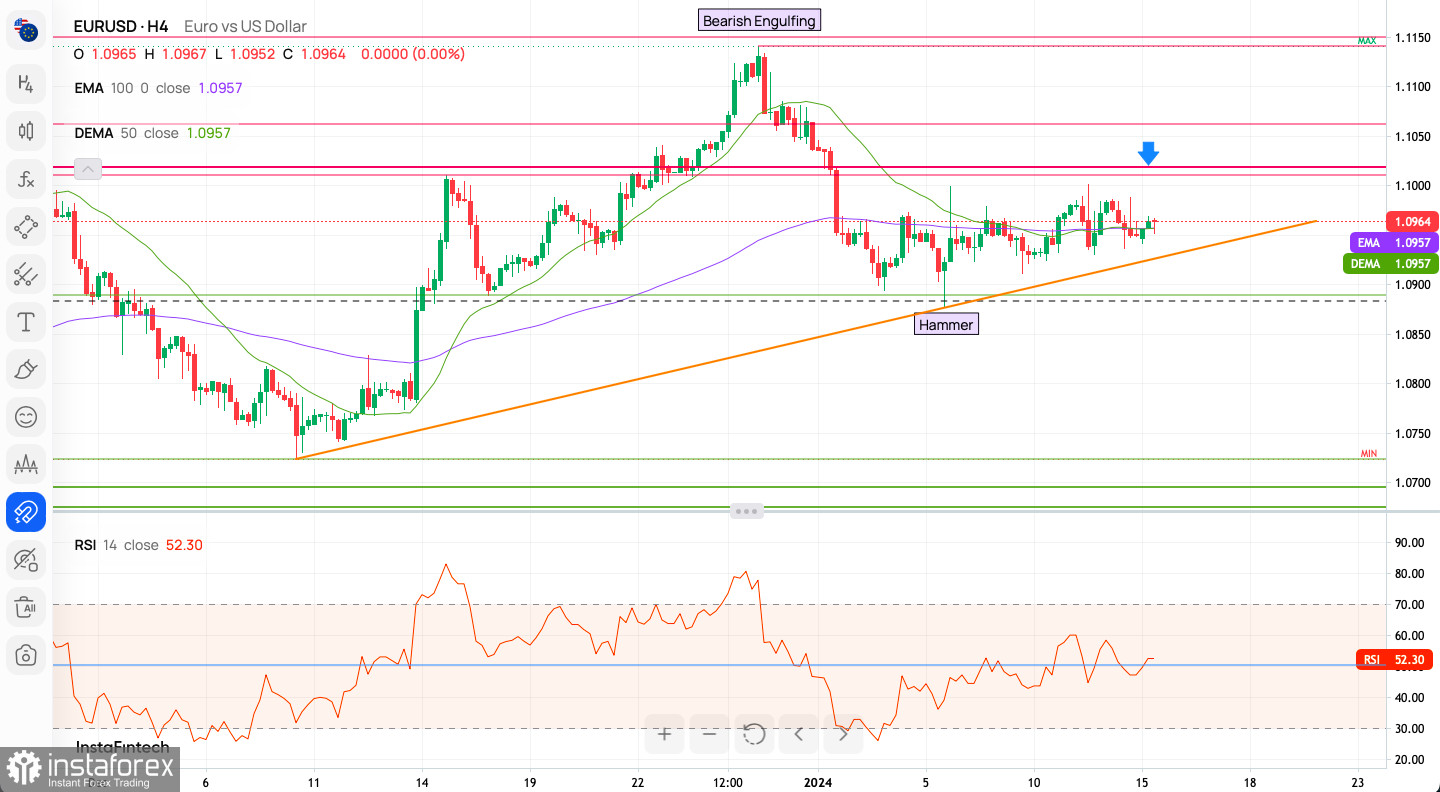
The EUR/USD pair remains in a consolidation phase within the 1.0877 - 1.0999 trading range. Traders are closely watching the key resistance at 1.1021 and support at 1.0877. The market's position just below the 100 MA at 1.0956 on the H4 chart is noteworthy, indicating a waiting game for a fundamental trigger to spark volatility.

Indicator Analysis: Deciphering Market Signals
- Trendlines and Moving Averages: The currency pair is interacting with a rising trendline, indicating an uptrend and acting as dynamic support. The 100-period EMA's flat trajectory suggests a pause in the trend, while the convergence of the 50-period DEMA with the 100-period EMA hints at a potential trend shift.
- Candlestick Patterns: The presence of a Bearish Engulfing pattern points to a possible trend reversal, while a Hammer pattern signals potential bullish momentum.
- Support and Resistance Levels: The price currently sits below a resistance level, indicating a potential barrier to upward movement.
- RSI Insights: At 52.30, the RSI is in neutral territory, hinting at a slight buyer momentum without overbought or oversold conditions.
EUR/USD H1 Intraday Indicator Analysis
The sentiment tilts towards a bullish stance, with a majority of technical indicators and moving averages signaling sell, reflecting the market's cautious optimism.
Weekly Pivot Points: Key Levels to Watch
- WR3: 1.10093
- WR2: 1.09826
- WR1: 1.09714
- Pivot: 1.09559
- WS1: 1.09447
- WS2: 1.09292
- WS3:1.09025
These pivot points serve as crucial markers for potential trend reversals and support or resistance levels.

Long-Term Outlook: Weekly Time Frame Analysis
The weekly chart offers a broader perspective on the EUR/USD dynamics:
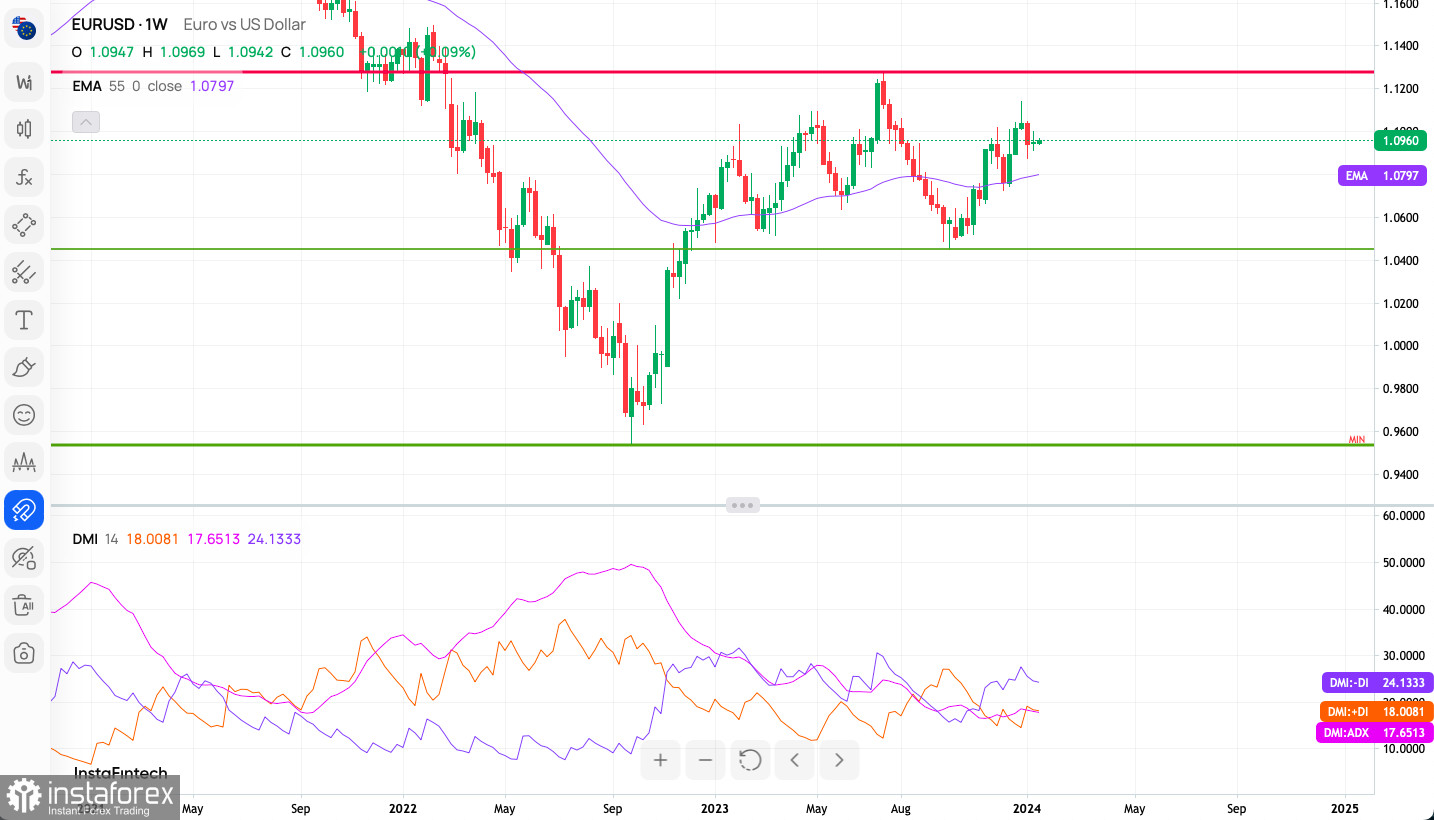
- Exponential Moving Average (EMA): The 55-period EMA, positioned above the market price, suggests potential resistance, hinting at a bearish sentiment.
- Directional Movement Index (DMI): The -DI line surpasses the +DI line, indicating a stronger downtrend. However, the ADX at 17.65 shows a relatively weak trend strength.
- Price Action: Recent bullish momentum is evident, but it's critical to observe if this can sustain or reverse at the resistance level.
Trading Insights: Navigating Current Market Dynamics
For Bulls: The current consolidation phase could present opportunities if the price breaks above the key resistance levels. Watching for a sustained move above the 100-period EMA and a shift in the DMI could signal strengthening bullish momentum.
For Bears: A rejection at the current resistance level and a strengthening of the downtrend indicated by the DMI could present favorable conditions. Monitoring for bearish candlestick patterns and a push below key support levels would be crucial.
Conclusion: Practical Takeaways for Traders
Today's forex landscape, particularly the EUR/USD pair, is marked by a mix of consolidation and anticipation. Traders should closely monitor the inflation reports from Europe and any shifts in the technical indicators to make informed decisions. It's essential to balance optimism with caution, as the market shows mixed signals that could sway in either direction.
Useful Links
Important Notice
The begginers in forex trading need to be very careful when making decisions about entering the market. Before the release of important reports, it is best to stay out of the market to avoid being caught in sharp market fluctuations due to increased volatility. If you decide to trade during the news release, then always place stop orders to minimize losses.
Without placing stop orders, you can very quickly lose your entire deposit, especially if you do not use money management and trade large volumes. For successful trading, you need to have a clear trading plan and stay focues and disciplined. Spontaneous trading decision based on the current market situation is an inherently losing strategy for a scalper or daytrader.


