 When to open long positions on EUR/USD:
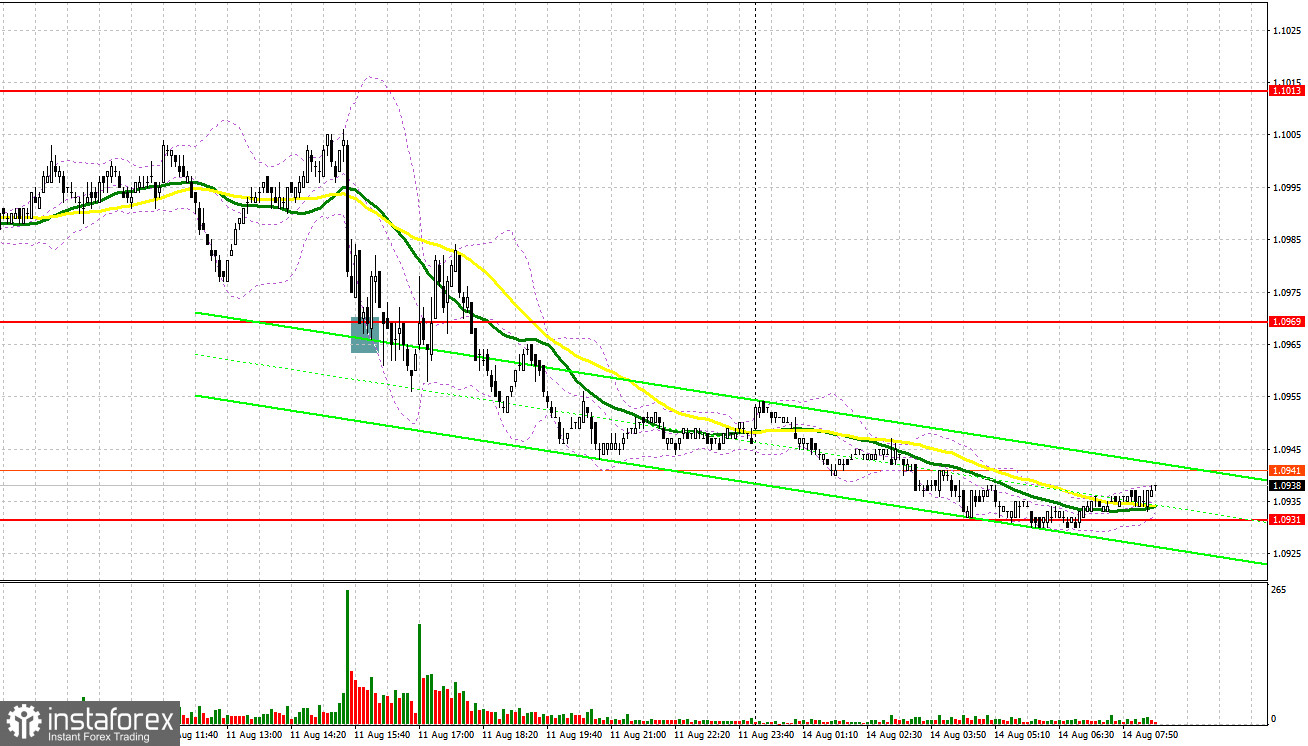
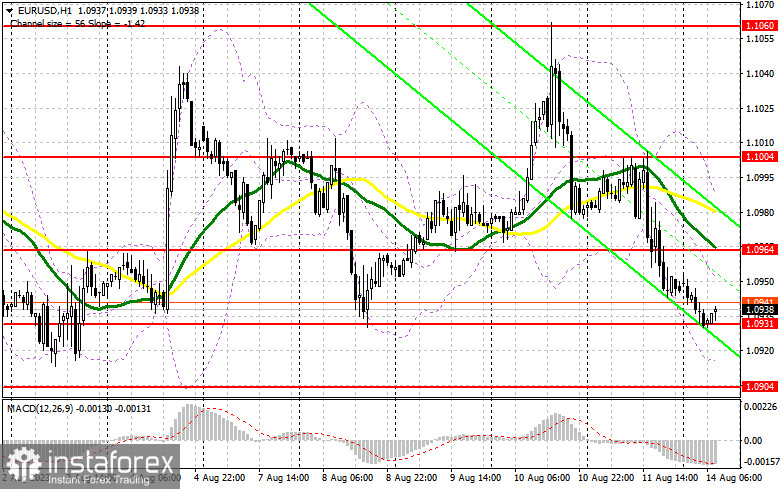
Pressure on EUR/USD increased because of strong data on the US Producer Price Index. The pair fell on Friday afternoon. It maintained a downtrend during today's Asian session. Many market participants doubt that interest rates in the United States have already peaked. Considering that today the economic calendar is empty except for Germany's Wholesale Price Index, the bears could push the pair to monthly lows. I am going to open to trade with this in focus. Only after a decline and a false breakout of the support level of 1.0931, will it be possible to get a good entry point into long positions in the expectation of an upward movement to the resistance level of 1.0964. At this level, the moving averages are passing in negative territory. A breakout and a downward retest of this level will boost demand for the euro. It is likely to reach a high of 1.1004 formed at the end of last Friday. A more distant target will be the 1.1060 level where I recommend locking in profits.
If EUR/USD declines and bulls fail to protect1.0931, which is quite possible, especially after a sell-off last Friday, the pressure on the pair will only escalate at the start of the week. In this case, only a false breakout of the support level of 1.0904 will provide new entry points into long positions. You could buy EUR/USD at a bounce from 1.0871, keeping in mind an upward intraday correction of 30-35 pips.
When to open short positions on EUR/USD:
Sellers have a chance of cementing the bearish trend. They need to push the pair to monthly lows. At the same time, they will have to defend the resistance level of 1.0964. A breakout of this level may take place in the morning. I will act only after a false breakout of this level, which could lead to another fall of the pair to the support level of 1.0931. Only after a breakout and consolidation below this level due to weak data from Germany, as well as an upward retest, there could be a sell signal. The pair is likely to drop to a low of 1.0904. A more distant target will be the 1.0871 level which will indicate the formation of a bearish trend. I recommend locking in profits there. If EUR/USD rises during the European session and bears show no activity at 1.0964, the bulls will try to return to the market again. If this scenario comes true, it is better to postpone short positions until a false breakout of the resistance level of 1.1004. You could go short after a rebound from 1.1060, keeping in mind a downward intraday correction of 30-35 pips.
COT report
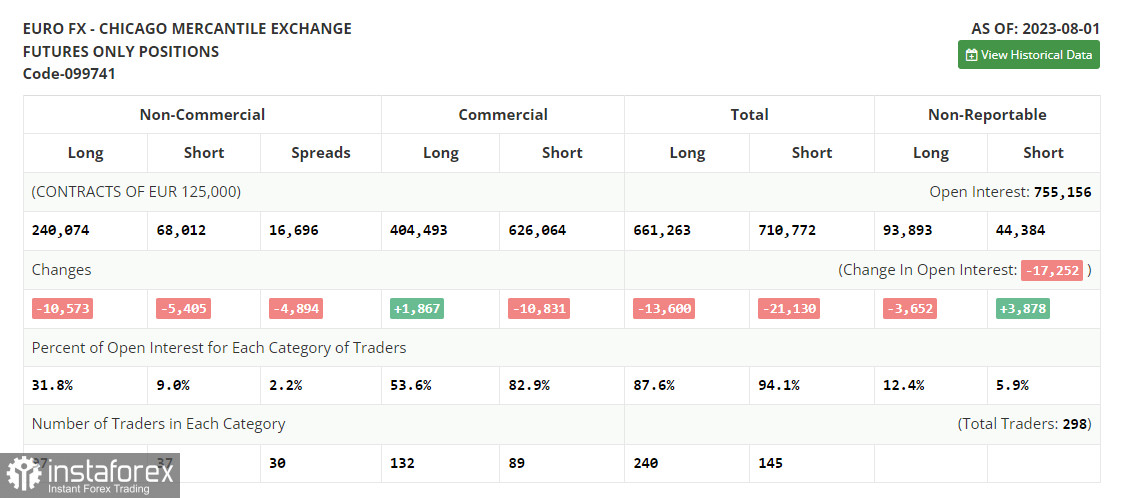
According to the COT report (Commitment of Traders) for August 1, there was a decline in both long and short positions. All this happened after the meetings of the Federal Reserve System and the European Central Bank. Now, traders are focused on fresh macro stats that will allow them to more accurately predict the Fed's future plans for monetary policy. In the near future, the US will release inflation data. A further decrease will certainly allow the Fed to take a break in September, while a rise in the index, on the contrary, will spark even more talk about the need for further tightening. It will be extremely bullish for the US dollar. Even despite the downward correction, in the medium term, it is better to open long positions on the decline. The COT report showed that long non-commercial positions decreased by 10,573 to 240,074, while short non-commercial positions fell by 5,405 to 68,012. As a result, the spread between long and short positions dropped by 4,894, which benefits the sellers. The closing price dipped to 1.0999 against 1.1075 a week earlier. Indicator signals:
Moving averages:
Trading is carried out below the 30-day and 50-day moving averages, which indicates a further fall.
Note: The author considers the period and prices of moving averages on the H1 (1-hour) chart that differ from the general definition of the classic daily moving averages on the daily D1 chart.
Bollinger Bands
If EUR/USD declines, the indicator's lower border at 1.0920 will serve as support.
Indicator description:
- Moving average (MA) determines the current trend by smoothing volatility and noise. Period 50. Colored yellow on the chart.
- Moving average (MA) determines the current trend by smoothing volatility and noise. Period 30. Colored green on the chart.
- Moving Average Convergence/Divergence (MACD). Fast EMA 12. Slow EMA 26. SMA 9.
- Bollinger Bands. Period 20
- Non-commercial traders are speculators such as individual traders, hedge funds, and large institutions who use the futures market for speculative purposes and meet certain requirements.
- Long non-commercial positions are the total long position of non-commercial traders.
- Non-commercial short positions are the total short position of non-commercial traders.
- Total non-commercial net position is the difference between the short and long positions of non-commercial traders.


