


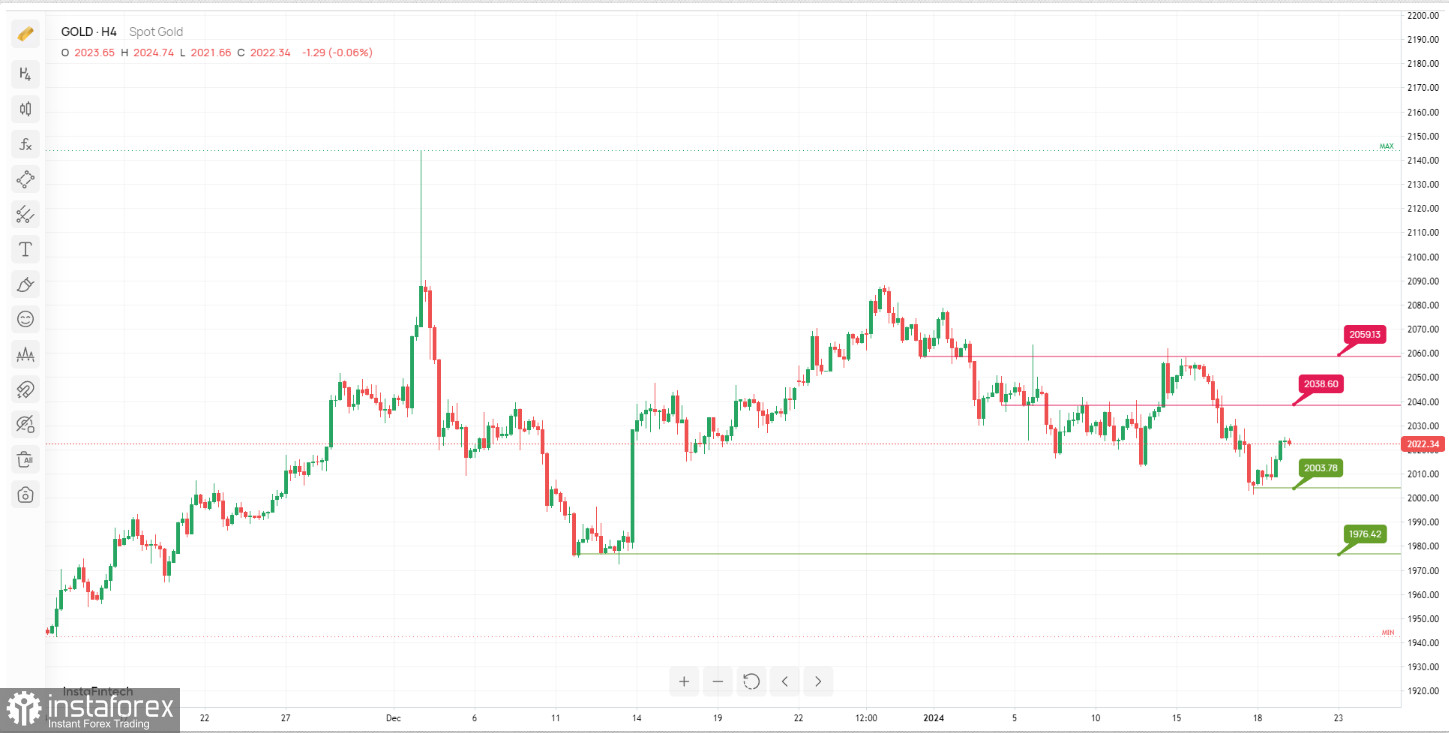
TheXAU/USD chart suggests a potential bearish scenario with a focus on a continuation towards the 1st support level. Here are the key support and resistance levels:
Resistance Levels:
The 1st resistance level at 2,038.60 is identified as an "Overlap resistance", this level could act as a significant barrier to further upward movement.
The 2nd resistance level at 2,059.13 is also labeled as an "Overlap resistance". It represents another level where selling pressure could emerge and hinder the price from moving higher.
Support Levels:
The 1st support level at 2,003.78 is a crucial support zone, marked as a "Pullback support". This level may attract buying interest and potentially act as a floor for the price.
The 2nd support level at 1,976.42 is also labeled as a "Pullback support". It serves as an additional support zone where traders might consider entering long positions.


