


Bitcoin's Downward Move Continues: Key Support Ahead
Key Takeaways:
- The BTC/USD pair exhibits a bearish trend, with key support levels breached.
- Moving averages and RSI indicate a bearish sentiment, but a potential oversold condition could signal a shift.
- Market sentiment is bullish, but shos a decline in optimism among Bitcoin traders.

In the world of cryptocurrency, Bitcoin's status often serves as a barometer for the entire market. Recently, the BTC/USD pair experienced significant movements, breaking below crucial short-term support levels. This analysis delves into the nuances of these movements and their implications for traders.
The Industry Context: Jamie Dimon's Stance and Bitcoin's ETF Milestone
In a landscape often characterized by rapid shifts and divergent opinions, the stance of influential figures like JPMorgan CEO (JPM) Jamie Dimon against Bitcoin becomes particularly significant, especially when juxtaposed with major milestones like the approval of Bitcoin ETFs in the United States.
Jamie Dimon's Persistent Skepticism Jamie Dimon has been a long-standing critic of Bitcoin, frequently voicing concerns about its legitimacy and utility. His latest remarks, made at the World Economic Forum 2024 in Davos, reiterate his belief that Bitcoin has limited real-world application, primarily serving to facilitate illegal activities such as fraud and tax evasion. Dimon's skepticism extends to questioning the capped supply of Bitcoin, suggesting a potential scenario where the creator, Satoshi Nakamoto, might unexpectedly intervene in the project. Such statements from a high-profile banking executive undoubtedly stir debate and skepticism in the financial community, impacting perceptions and potentially influencing market dynamics.

The Significance of Spot BTC ETF Funds Contrasting Dimon's views, the approval of spot BTC ETF funds in the US marks a significant step towards mainstream acceptance of Bitcoin. ETFs offer a regulated and more accessible way for investors to gain exposure to Bitcoin, without the complexities of handling the cryptocurrency directly. This development is seen as a nod to the growing legitimacy and potential of Bitcoin in the broader financial landscape. It represents a milestone in integrating cryptocurrencies into traditional investment portfolios, potentially attracting a new wave of institutional and retail investors.
Balancing Perspectives The tension between Dimon's criticisms and the advancement of Bitcoin ETFs highlights the complex and often conflicting narratives surrounding cryptocurrencies. On one hand, there are concerns about the risks and speculative nature of cryptocurrencies. On the other, there is growing recognition of their potential as investment assets and their role in diversifying investment strategies.
Technical Market Outlook: Bearish Signals Amidst New Highs
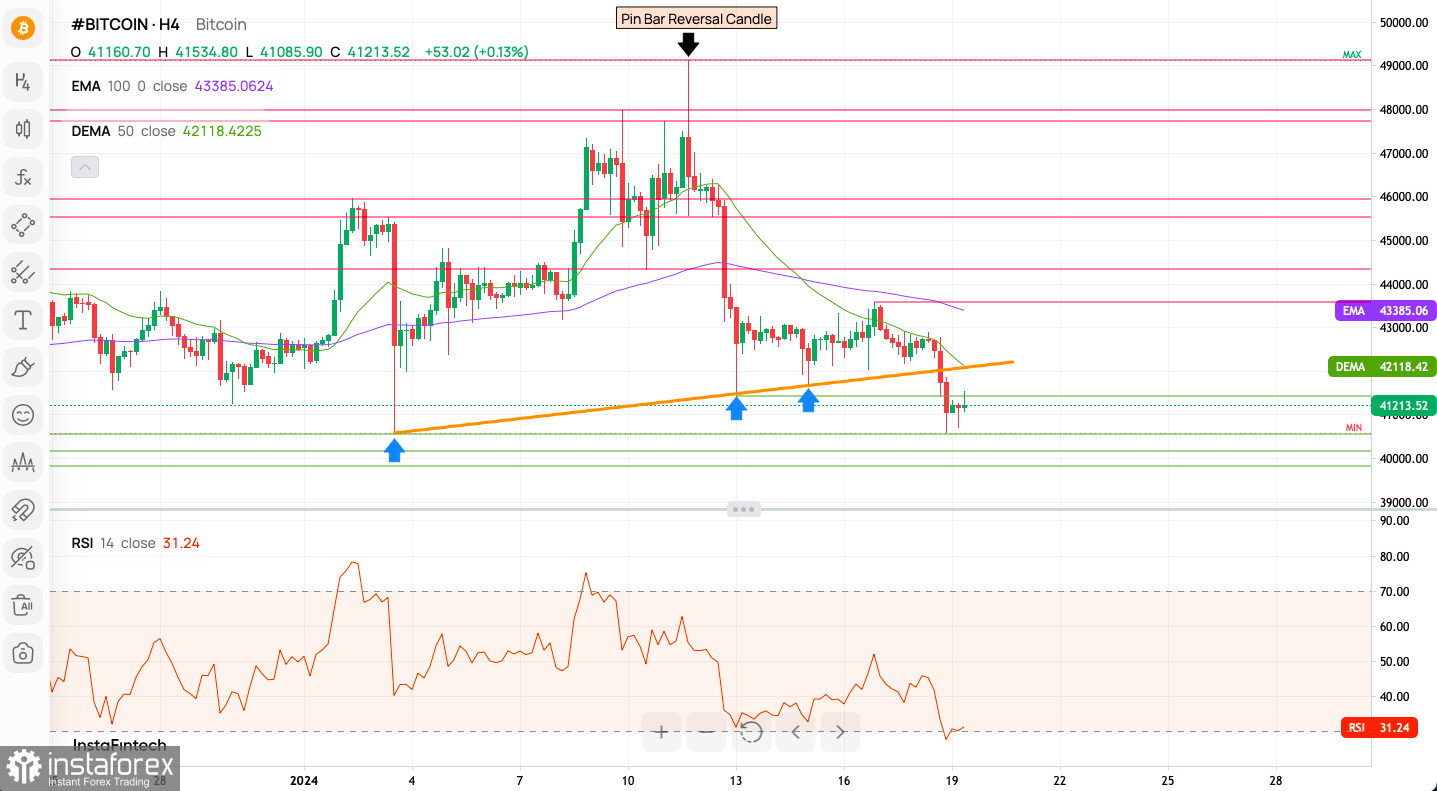
After reaching a yearly high of $49,126, BTC/USD reversed sharply, indicating bearish momentum. The drop to a new low of $40,598, breaking past several support levels, suggests a continuation of this trend. Critical resistance and support levels are at $41,400 and $40,598, respectively.
Analyzing the Technical Indicators
- Trend Analysis: Lower highs and lows point to a short-term downtrend.
- Moving Averages: Both EMA 100 and DEMA 50 are above current prices, signaling bearish sentiment.
- Candlestick Patterns: The presence of a Pin Bar Reversal Candle indicates a rejection of higher prices.
- Relative Strength Index (RSI): An RSI close to 30 suggests a potential oversold market, which could lead to a reversal if conditions align.
Evaluating Market Sentiment and Pivot Points
Despite the bearish technical indicators, overall market sentiment remains bullish. However, a noticeable decrease in bullishness among traders is evident. Additionally, monthly pivot points provide critical levels for potential trend reversals and support/resistance.
WR3 - $60,342
WR2 - $52,233
WR1 - $47,421
Weekly Pivot - $44,125
WS1 - $39,312
WS2 - $36,015
WS3 - $27,908
Insights for Traders For bullish traders, cautious optimism is advised until a clear reversal pattern emerges and the RSI moves out of the oversold region. Meanwhile, bearish traders should monitor if the price reclaims broken support levels and moving averages, which could signal a change in trend. In both scenarios, staying informed and agile in response to market changes is crucial.
Useful Links
Important Notice
The begginers in forex trading need to be very careful when making decisions about entering the market. Before the release of important reports, it is best to stay out of the market to avoid being caught in sharp market fluctuations due to increased volatility. If you decide to trade during the news release, then always place stop orders to minimize losses.
Without placing stop orders, you can very quickly lose your entire deposit, especially if you do not use money management and trade large volumes. For successful trading, you need to have a clear trading plan and stay focues and disciplined. Spontaneous trading decision based on the current market situation is an inherently losing strategy for a scalper or daytrader.


