The GBP/USD Outlook: Insights Into Current Movements
Key Takeaways:
- GBP/USD shows potential reversal signs after recent gains.
- Critical support and resistance levels identified.
- Mixed signals from technical indicators and moving averages.
GBP Bulls Face a Reversal Challenge
Today's market lacks major macroeconomic releases, setting a calm tone ahead of a week packed with significant events, including ECB and BoC decisions and vital data from the Eurozone and the USA. The Conference Board index will be today's highlight, providing insights into the US economy's momentum.

Despite unrest in the Middle East and a turbulent session in Chinese indices, oil prices remained unaffected, and European markets opened higher, showing resilient investor sentiment.
Technical Market Outlook:
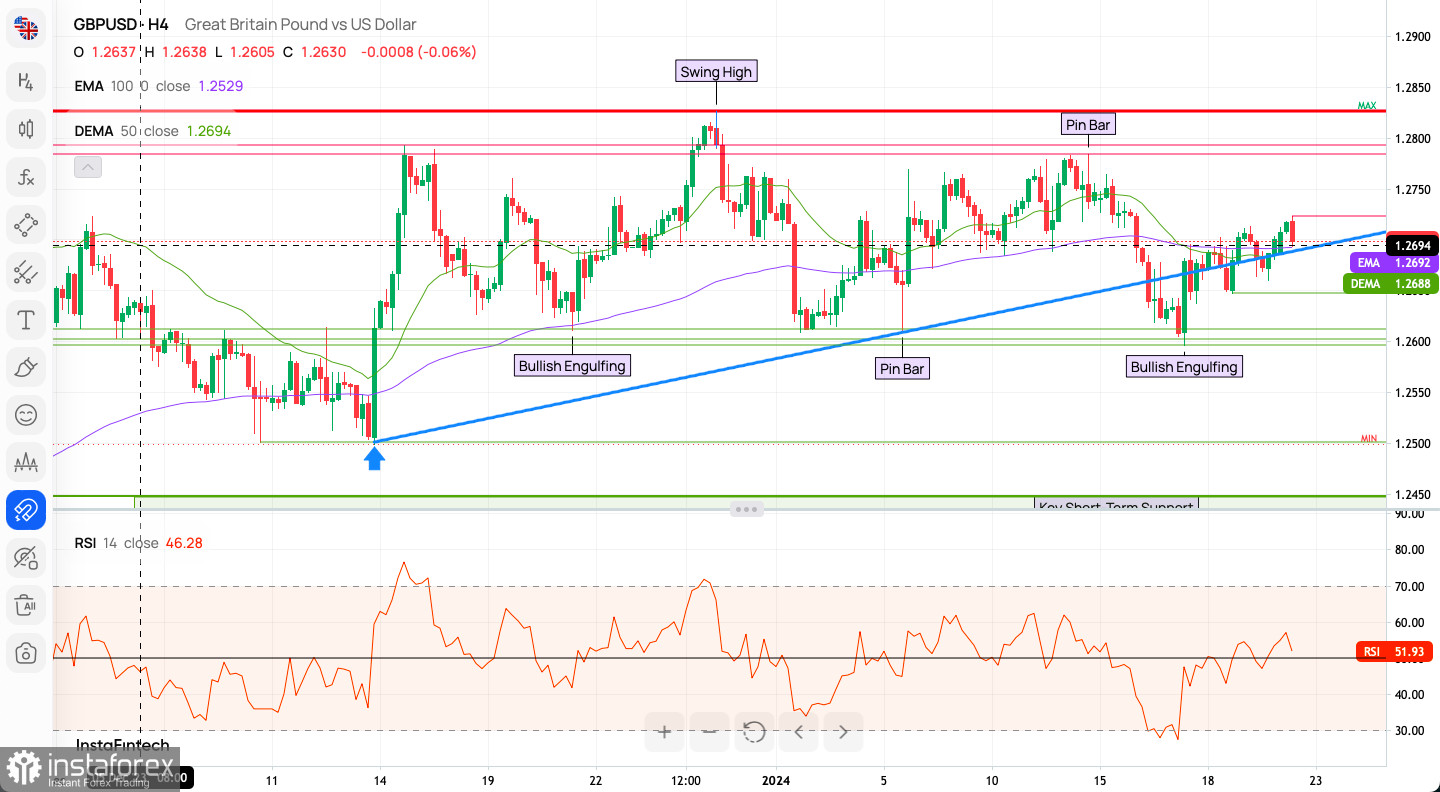
Recently, GBP/USD spiked above the H4 time frame's 50 MA, reaching a high of 1.2723 before reversing. Bears now target 1.2675 and 1.2645, key intraday support levels. The resistance is at 1.2723. A shift in momentum indicates a possible change from positive to neutral or negative sentiment in the short term. A sustained break below 1.2615 to 1.2595 would signify a more bearish outlook.
Trend Analysis and Key Levels
The pair is in a medium-term range, oscillating between support and resistance levels. Currently near the upper range, resistance might soon follow. Key resistance at 1.2850 ("Swing High") and support around 1.2500 ("Very Short Term Support") are crucial for traders' strategies.
Moving Averages and Candlestick Patterns
The EMA 100 and DEMA 50 are below the price, indicating bullish sentiment. However, their proximity suggests possible market consolidation. Candlestick patterns like "Bullish Engulfing" and "Pin Bar" formations provide additional insight into potential market reversals.
Momentum Indicator
The RSI near 51.93 suggests neither overbought nor oversold conditions, aligning with a consolidation view.
GBP/USD Intraday H1 Indicator Analysis
- Buy signals: 9 out of 21 technical indicators.
- Neutral: 8 indicators.
- Sell signals: 5 indicators.
- Moving Averages: 8 indicating Sell, 10 indicating Buy.
Market Sentiment
Current sentiment is bullish (58% vs. 42% bears). This trend continues from last week and the past three days.
Weekly Pivot Points
- WR3: 1.27727
- WR2: 1.27416
- WR1: 1.27282
- Pivot: 1.27105
- WS1: 1.26971
- WS2: 1.26794
- WS3: 1.26483
Trading Insights for Bulls and Bears
Bulls should watch for the price to consistently stay above the EMA and DEMA, indicating a shift back to bullish momentum. Holding above key short-term support is vital.
For bears, a break below the trendline could forecast a bearish trend. However, the presence of bullish engulfing patterns suggests potential for a rally. The RSI suggests seller momentum is weakening, but without clear signs of an immediate reversal.
Useful Links
Important Notice
The begginers in forex trading need to be very careful when making decisions about entering the market. Before the release of important reports, it is best to stay out of the market to avoid being caught in sharp market fluctuations due to increased volatility. If you decide to trade during the news release, then always place stop orders to minimize losses.
Without placing stop orders, you can very quickly lose your entire deposit, especially if you do not use money management and trade large volumes. For successful trading, you need to have a clear trading plan and stay focues and disciplined. Spontaneous trading decision based on the current market situation is an inherently losing strategy for a scalper or daytrader.


