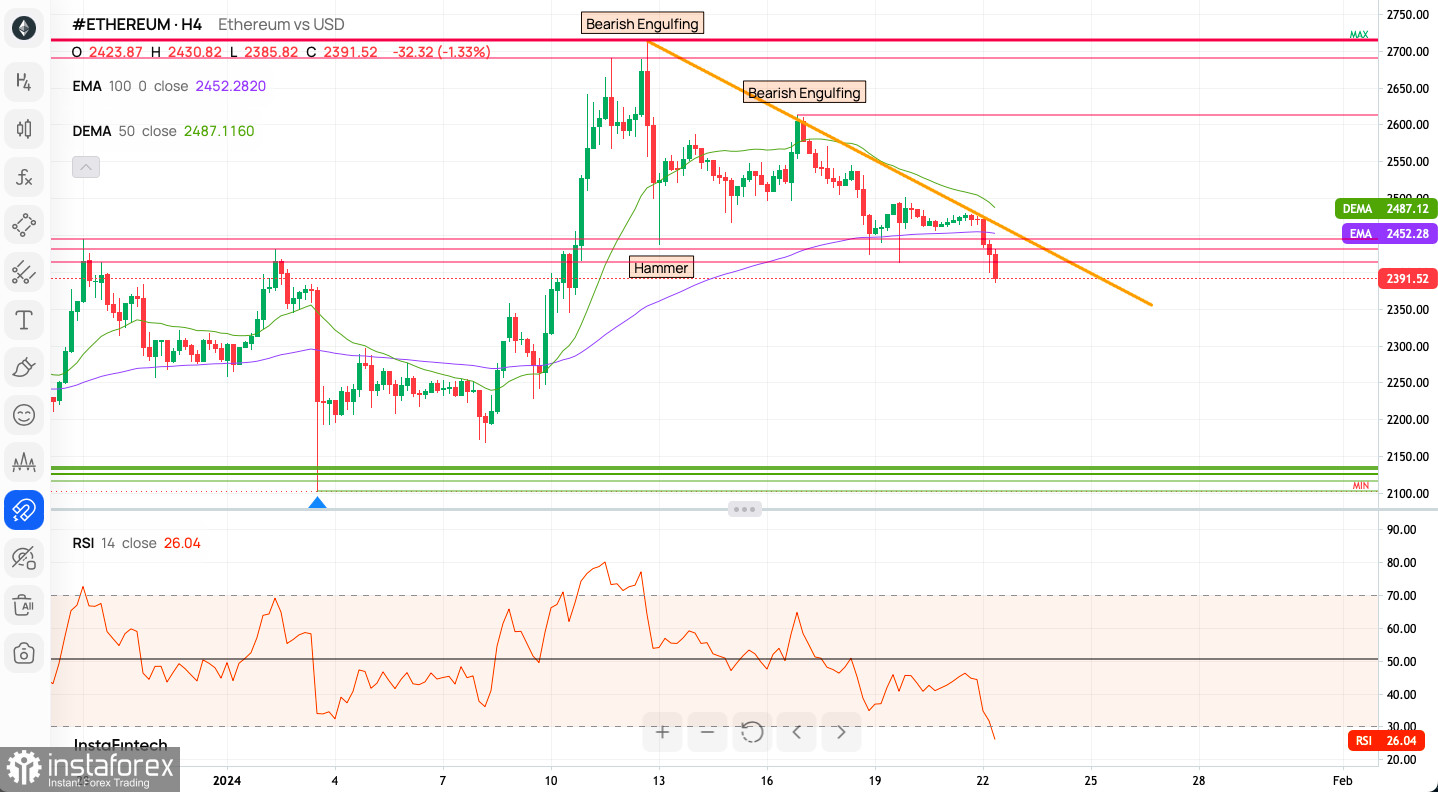
Ethereum's Technical Picture After the Breakout Below Support
Current State of Ethereum: Market Analysis and Future Outlook
Ethereum, a leading cryptocurrency, has recently experienced notable fluctuations. This article provides an in-depth technical analysis of Ethereum (ETH) against the US Dollar (USD), exploring its current market position and potential future movements.

Ethereum's Market Performance: A Technical Perspective
Recent Price Movements:Ethereum has witnessed a decline of almost 10% in recent days. This trend raises questions about its stability and future growth prospects. Despite the downturn, there's a possibility of consolidation, which could set the stage for an upward trajectory. A breakout might lead to a substantial increase, potentially surpassing the $3,000 mark.
Staking and Availability on Exchanges:An interesting aspect is Ethereum's supply dynamics. Currently, 24% of its total supply is staked, with only 11% available on exchanges. The recent Shapella upgrade did not diminish the rate of staking; instead, it continues to grow.
Technical Indicators Analysis:
- Relative Strength Index (RSI): At 54, it indicates a balanced market without clear signs of overbought or oversold conditions.
- Moving Averages: The 50-day and 200-day EMAs are almost identical, at around $2,477 and $2,478, suggesting a consolidated market stance.
- Resistance and Support Levels: If Ethereum begins to rise, resistance is expected at $2,711, followed by potential jumps to $2,982 and $3,231. Conversely, the first resistance in a downward trend is at $2,135, followed by $1,903 and $1,648.
Intraday Technical Signals: A Snapshot
- Technical Indicators: All 23 indicators signal a sell.
- Moving Averages: 18 out of 18 moving averages also suggest a sell.

Market Sentiment: Understanding Trader Perspectives
The general market sentiment is predominantly bullish, with a significant majority favoring this outlook over the past week and days.
Weekly Pivot Points: Key Market Levels
- WR3: $2,556
- WR2: $2,488
- WR1: $2,449
- Weekly Pivot: $2,421
- WS1: $2,382
- WS2: $2,353
- WS3: $2,286
Technical Insights:
Bearish Engulfing Pattern:A bearish engulfing candlestick pattern hints at a potential reversal, indicating a shift in control to bears after a price increase.
EMA and DEMA Analysis:The price is trapped between the 100-period EMA and the 50-period DEMA, with the EMA below the DEMA, suggesting a possible bearish crossover.
RSI and Price Dynamics:The RSI stands at 51.51, relatively neutral, indicating neither strong bullish nor bearish momentum. The significant price drop also points to recent bearish movements.
Trading Scenarios: Bullish and Bearish Perspectives
Bullish Scenario:
- Recovery and support at the EMA could signal a bullish trend.
- Neutral RSI leaves room for upward movement.
- The DEMA could act as dynamic support, reinforcing bullish momentum.
Bearish Scenario:
- Continued decline post-bearish engulfing pattern indicates bear dominance.
- Falling below the EMA could confirm a bearish trend.
- A declining RSI may suggest increasing selling pressure.
Key Takeaways
- Market Volatility: Ethereum's price has been volatile, with a recent downward trend.
- Technical Indicators: Current indicators suggest a bearish outlook, but the market is in a state of balance.
- Market Sentiment: Despite bearish technical signals, the overall sentiment remains bullish.
Conclusion
Ethereum's market performance is marked by volatility and uncertainty. While technical indicators lean towards a bearish outlook, the overall market sentiment remains bullish. Traders should closely monitor these dynamics, combining technical analysis with broader market trends and news. It is crucial to apply comprehensive risk management strategies in this unpredictable market.


