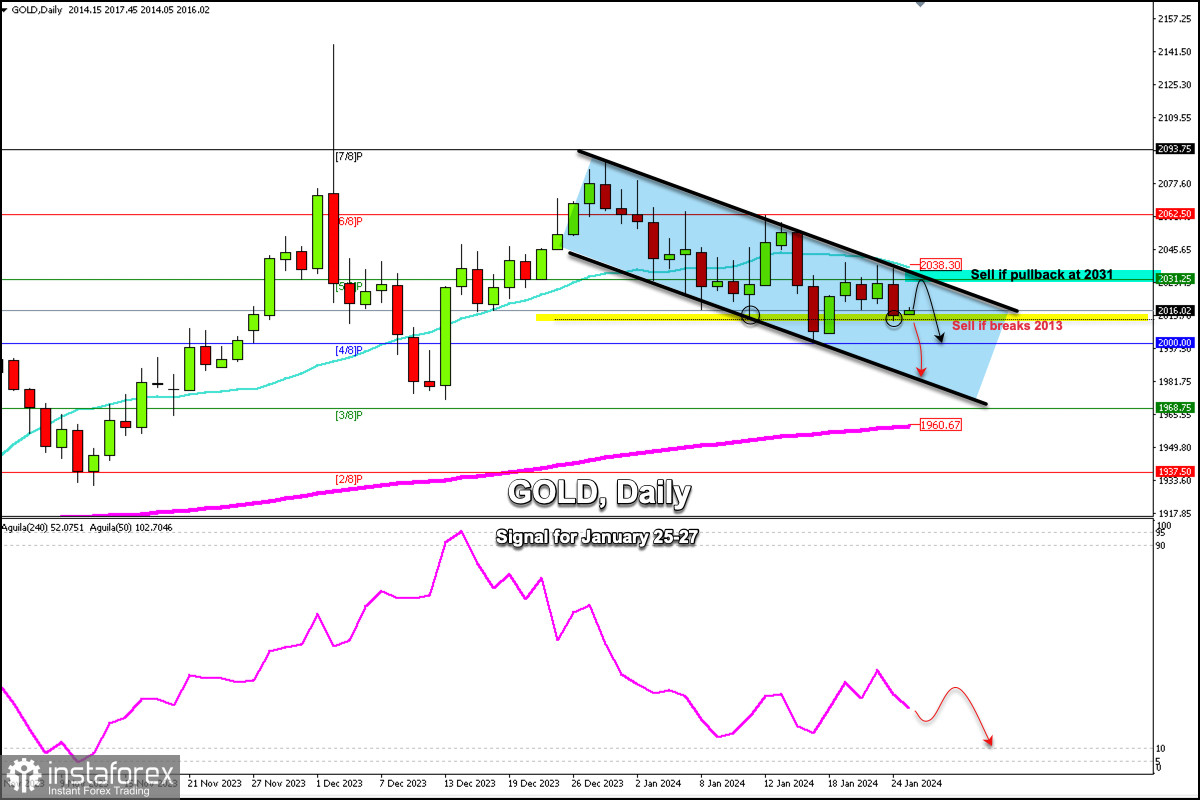
According to the daily chart, gold has been trading within a bearish trend channel since December 19. Yesterday during the American session, it tried to break this channel, reaching the top of the trend channel around 2,035. As it was not successful and the bullish force was exhausted, we saw a strong technical correction and the price reached the weekly support of 2,011.13.
We currently observe that the XAU/USD is having a technical rebound, moving away from the 2,011 low and forming a small bullish candlestick.
However, if gold consolidates above 2,015, we could see a recovery and the instrument could reach 5/8 Murray around 2,031 or around the top of the downtrend channel at 2,033.
On the other hand, if gold decisively breaks the weekly support located at 2,015 and consolidates below 2,013, we could expect a downward acceleration towards the psychological level of $2,000. The metal could even reach the bottom of the downtrend channel around 1,975.
The key for the next few days for gold will be to consolidate above 2,015 so that we can look for buying opportunities with targets at 2,031 or even at the 21 SMA at 2,038.
On the contrary, if gold falls below 2,013, it could be seen as a signal to sell in the coming days, with targets at the psychological level of $2,000 and at 3/8 Murray located at 1,968. Finally, the price could drop to the 200 EMA at 1,960.
In case gold breaks the downtrend channel and consolidates above 2,040, it could be seen as the beginning of a sustained recovery and the metal could reach 6/8 Murray at 2,062. The price could even rebound to 2,093.
The eagle indicator is giving a negative signal. Any technical bounce while trading below 2,040 will be seen as an opportunity to sell with the target at 1,960.


