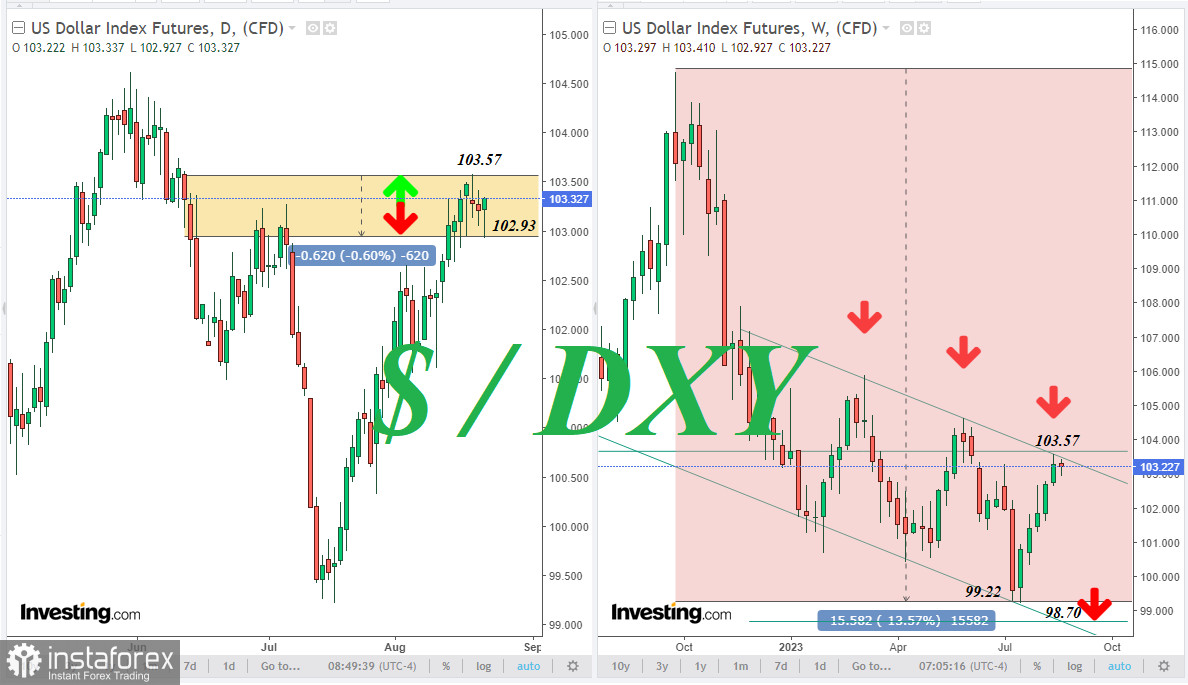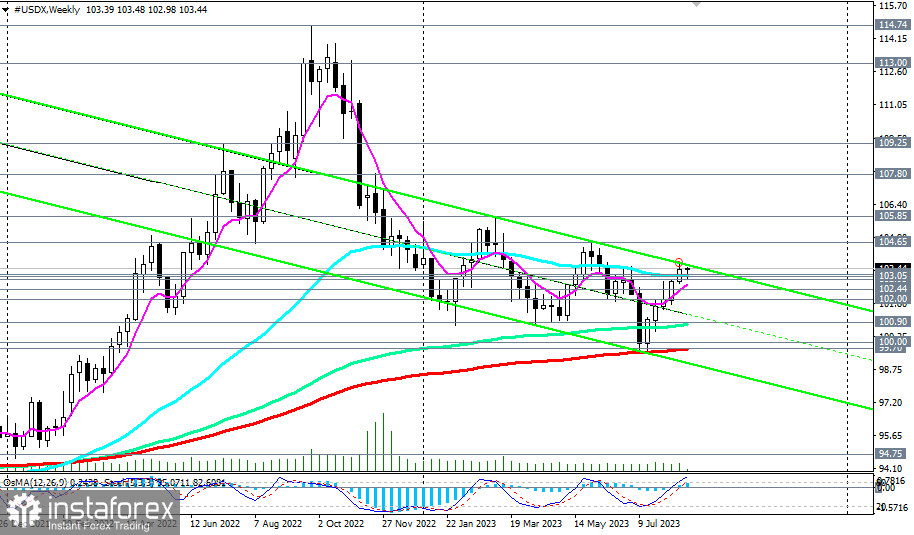
The reasons for the downward dynamics of the dollar are not entirely clear yet, but if it continues, then, from a technical perspective, it is logical to assume a decline in DXY to the lower boundary of the downward channel on the weekly chart of the dollar index, which is near the 98.70 mark (projected to today's date). This is approximately 4.5% below the current level of 103.23. If events unfold unfavorably for the dollar, its decline, including against its major competitors in the currency market, may extend for 2–3 months.

Economists and market participants are evaluating how the Federal Reserve will respond to inflation, which continues to decline after reaching a 40-year high in June 2022. Many believe that the Fed will move to cut interest rates by the end of the year or the beginning of the next. This is preventing the dollar from strengthening more sharply.

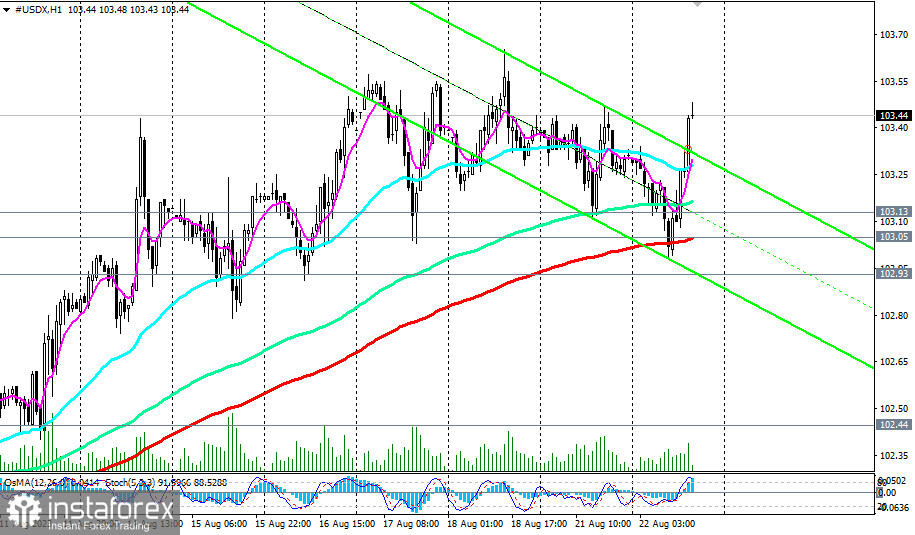
Today, the U.S. dollar underwent a correction, and its DXY index declined during the Asian trading session. However, as of writing, DXY began to rise again and reached the 103.44 mark.
A break above the upper boundary of the newly formed range between the levels 103.57 and 102.93 could signal the resumption of long positions in DXY (CFD #USDX in the MT4 terminal).

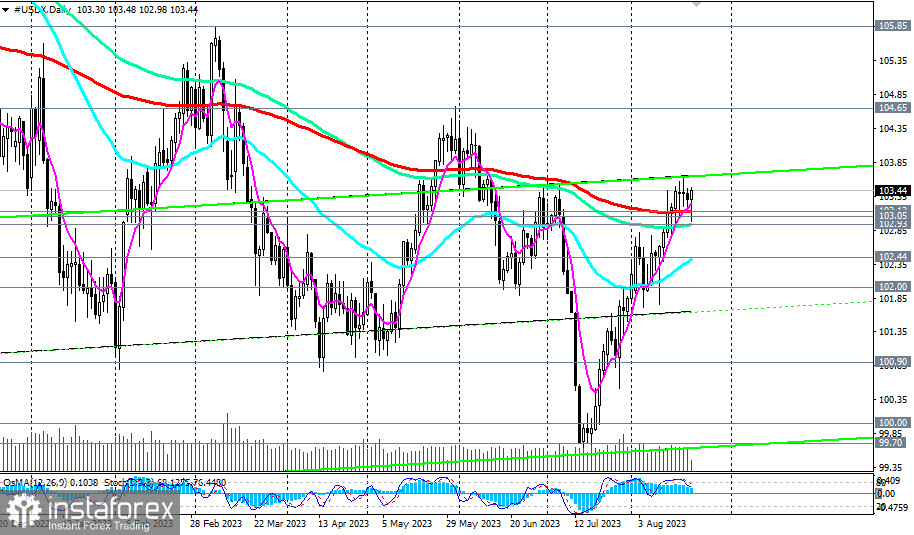
In an alternative scenario, a break below the key medium-term support level 103.13 (200 EMA on the daily chart), 103.05 (200 EMA on the 1-hour chart), and today's low (144 EMA on the daily chart) 102.93, will signal the resumption of the downward dynamics in DXY.
The targets for the decline are located at the key support levels 100.90 (144 EMA on the weekly chart), 100.00, and 99.70 (200 EMA on the weekly chart). A break below the key support level 99.70 will bring DXY into the long-term bear market zone.
Support Levels: 103.13, 103.05, 102.93, 102.44, 102.00, 101.00, 100.90, 100.00, 99.70
Resistance Levels: 103.57, 104.00, 104.65, 105.00, 105.85


