


Trend analysis (Fig. 1).
The EUR/USD currency pair may move upward from 1.0844 (closing of yesterday's daily candle) to the target level at 1.0897, the 14.6% pullback level (blue dotted line). Upon reaching this level, a downward movement is possible to 1.0880, the 61.8% pullback level (red dotted line).
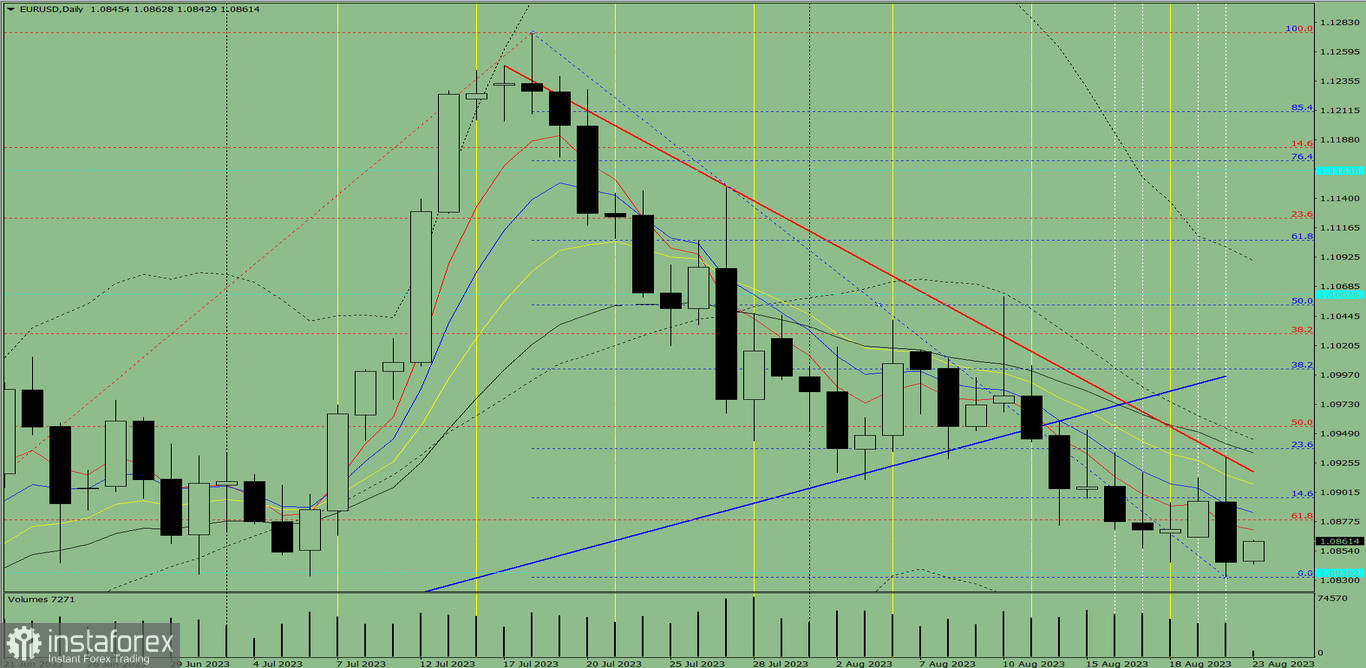
Fig. 1 (daily chart).
Comprehensive analysis:
- Indicator analysis - up;
- Fibonacci levels - up;
- Volumes - up;
- Candlestick analysis - up;
- Trend analysis - up;
- Bollinger bands - up;
- Weekly chart - up.
General conclusion:
Today, the price may move upward from 1.0844 (closing of yesterday's daily candle) to the target level at 1.0897, the 14.6% pullback level (blue dotted line). Upon reaching this level, a downward movement is possible to 1.0880, the 61.8% pullback level (red dotted line).
Alternatively, the price may move upward from 1.0844 (closing of yesterday's daily candle) to the target level at 1.0880, the 61.8% pullback level (red dotted line). Upon reaching this level, a downward movement is possible to the lower fractal at 1.0833 (blue dotted line).


