


Trend analysis (Fig. 1).
The GBP/USD currency pair may move upward from the level of 1.2729 (closing of yesterday's daily candle) to 1.2751, the 21-day EMA (black thin line). In the case of testing this level, a downward movement is possible to 1.2692, the 14.6% pullback level (red dotted line).
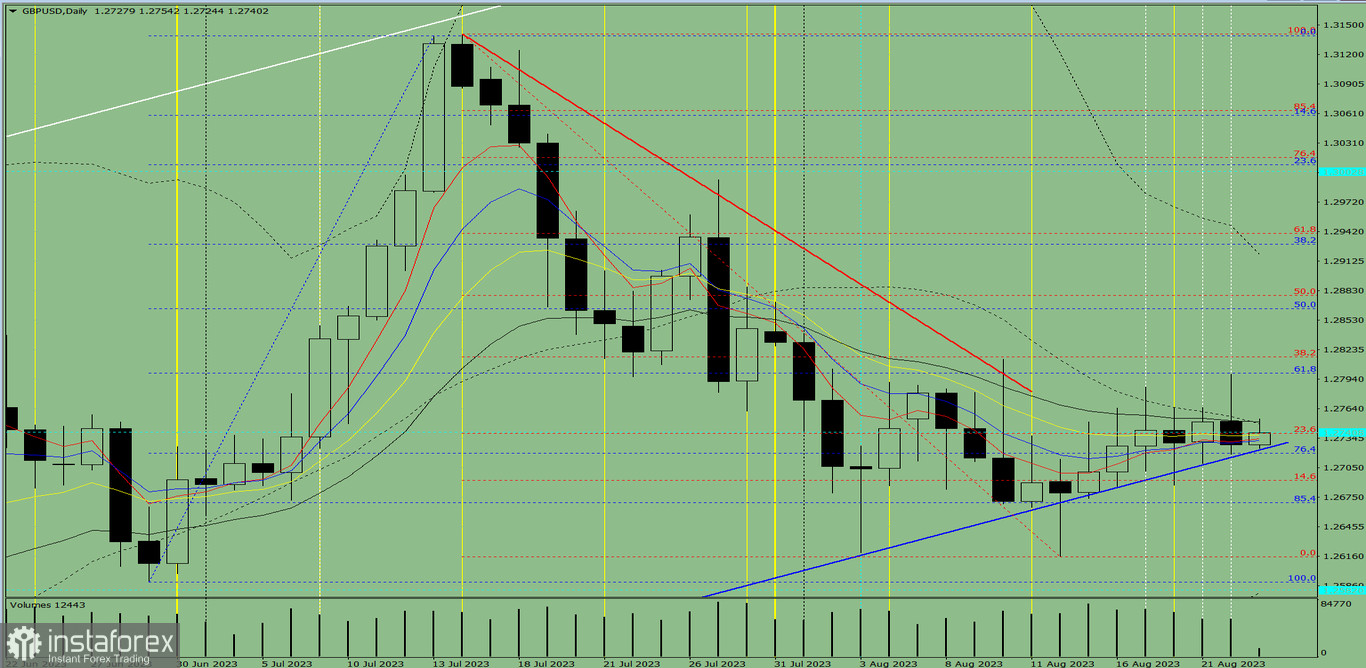
Fig. 1 (daily chart).
Comprehensive analysis:
- Indicator analysis - up;
- Fibonacci levels - up;
- Volumes - up;
- Candlestick analysis - up;
- Trend analysis - up;
- Weekly chart - up;
- Bollinger Bands - up.
General conclusion:
Today, the price may move upward from the level of 1.2729 (closing of yesterday's daily candle) to 1.2751, the 21-day EMA (black thin line). In the case of testing this level, a downward movement is possible to 1.2692, the 14.6% pullback level (red dotted line).
Alternatively, the price may move upward from the level of 1.2729 (closing of yesterday's daily candle) to 1.2799, the 61.8% pullback level (blue dotted line). In the case of testing this level, a downward movement is possible to 1.2751, the 21-day EMA (black thin line).


