GBP/USD Under Bearish Influence: A Closer Look
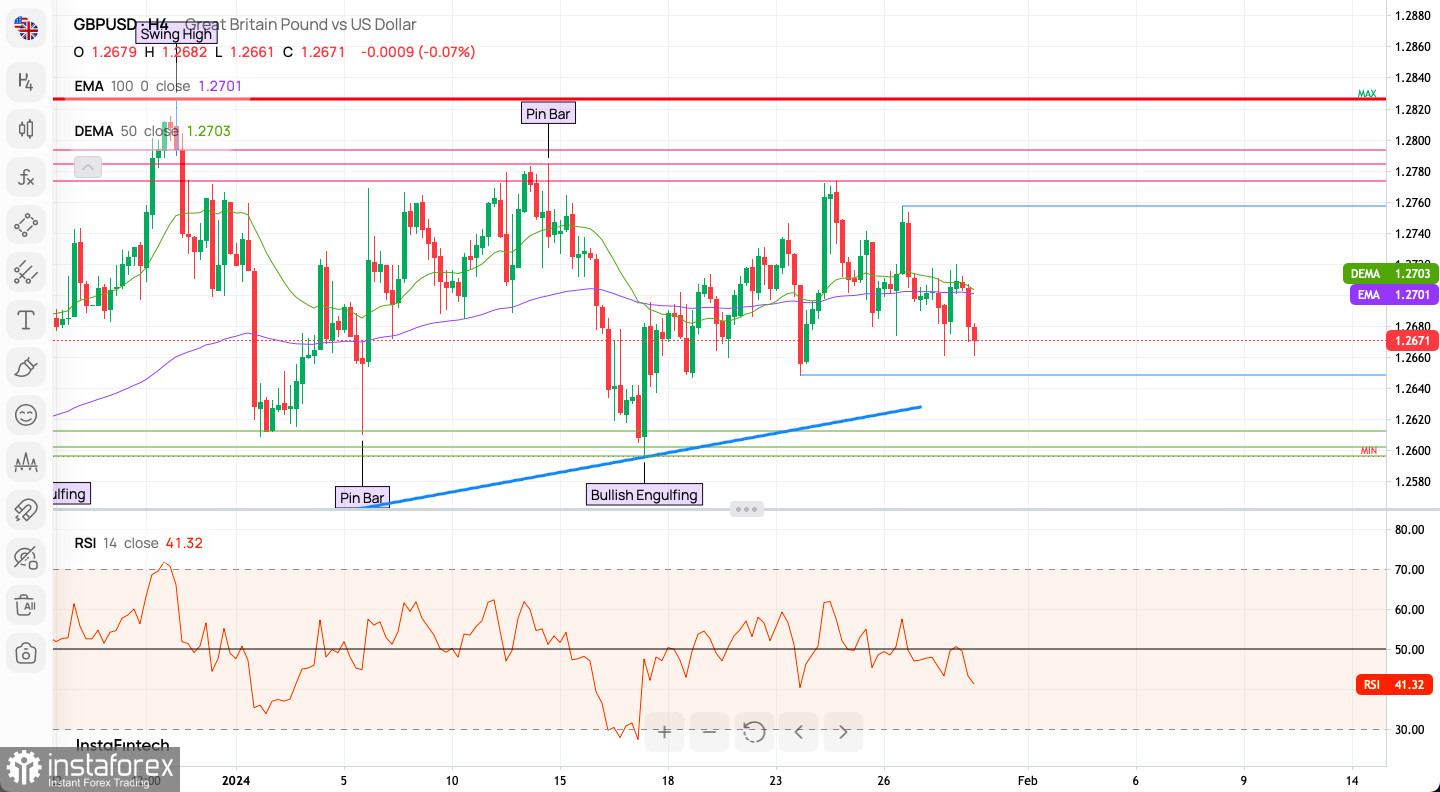
The GBP/USD pair exhibited a spike above the 50 MA on the H4 chart, reaching a high at 1.2757, before reversing back into the range zone. Bears are now eyeing targets at 1.2675 and 1.2648, which serve as intraday support levels. Resistance is established at 1.2757 and 1.2773.

Technical Insights:
- Candlestick Patterns: The chart indicates the presence of a 'Pin Bar', which is typically seen as a reversal pattern. There is also a 'Bullish Engulfing' pattern, which may suggest that buyers are gaining control and could potentially reverse the trend.
- Moving Averages: The price is hovering around the 100-period Exponential Moving Average (EMA) and just below the 50-period Double Exponential Moving Average (DEMA), which could act as dynamic resistance levels.
- Support and Resistance: The currency pair has a clear range with established support and resistance levels. The price is currently trading closer to the lower end of this range, indicating a potential area for a bounce if support holds.
- Relative Strength Index (RSI): With an RSI value of around 41, the market is neither in the overbought nor oversold territory, suggesting there is room for movement in either direction without immediate pressure from extreme conditions.

H1 Intraday Indicator Analysis:
- Sell Signals: 17 out of 21 technical indicators.
- Neutral Signals: 2 indicators.
- Buy Signals: 2 indicators.
- Moving Averages: All 18 indicate Sell.
Market Sentiment:
The general sentiment remains bullish (58% vs. 42% bears), consistent with last week's sentiment (56% bulls vs. 44% bears). However, there has been a recent shift towards bearish sentiment in the last three days (48% bulls vs. 52% bears).
Weekly Pivot Points Analysis
- Upper Resistance Levels: WR3 - 1.27609, WR2 - 1.27332, WR1 - 1.27202.
- Weekly Pivot: 1.27055.
- Lower Support Levels: WS1 - 1.26925, WS2 - 1.26778, WS3 - 1.26501.
Bullish Scenario:
- Confirmation of Reversal Patterns: If the market respects the bullish patterns and follows through with upward price action, we could see the pair moving towards the resistance levels.
- Break Above Moving Averages: A price movement above both the DEMA and EMA with increased volume could signal a shift to bullish momentum, potentially leading to a test of the upper resistance levels.
Bearish Scenario:
- Failure to Hold Support: If the price breaks below the current support level and the recent lows, this could signal a continuation of the bearish trend and potentially lead to further downside movement.
- Rejection at Moving Averages: If the price fails to break above the moving averages and gets rejected, this could act as a confirmation of the bearish sentiment, leading to a retest of the lower support or new lows.
Conclusion:
The GBP/USD pair is at a critical juncture, showing signs of potential reversal but still within a bearish context due to the recent downtrend. The next trading sessions will be crucial in determining whether the bulls can capitalize on the reversal signals and push the price higher or if the bears will continue to dominate, leading to a further decline in price. Traders should watch for confirmation of the bullish signals and manage risk appropriately, keeping an eye on key technical levels and market news that could impact currency movements.


