GBP/USD:
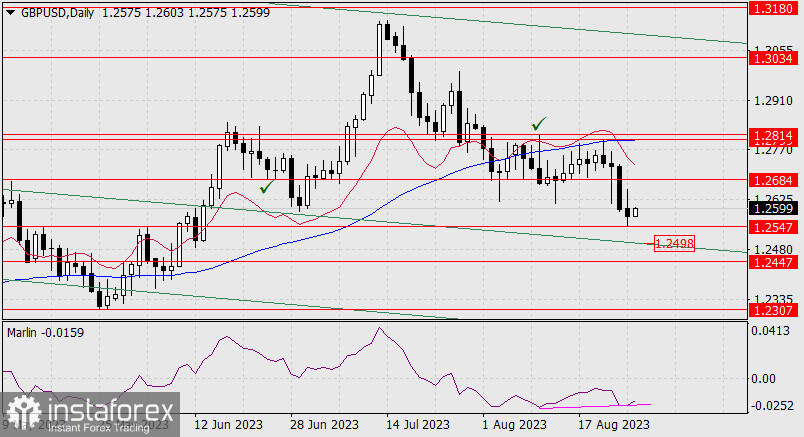
On Friday, the British pound marked its low at the 1.2547 level - a resistance level from June 2 and May 15. This morning, the price almost covered the body of Friday's candle with its rise. On the daily chart, the Marlin oscillator has formed a not-so-strong convergence. Such a convergence is enough for the price to rise to the first resistance level that is quite strong, which in this case is the 1.2799 level - the peak of August 22, coinciding with the MACD line.

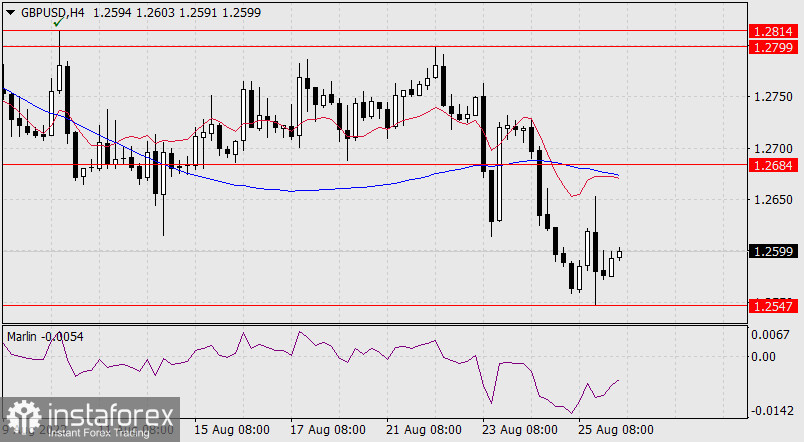
Slightly above, there's the resistance from the August 10 peak at 1.2814. As the price rises, it will approach the MACD line, so the bullish target is the 1.2799-1.2814 range. The first target for the corrective growth is the 1.2684 level – the low of June 23.
It is quite difficult for the price to fall further - three strong supports lie in its path: 1.2547, 1.2498, and 1.2447 (the peak of January 2023 and December 2022).

On the four-hour chart, the Marlin oscillator is vigorously rising, as it aims to enter the positive territory before the price reaches the MACD line. This is a signal. If the price consolidates above 1.2684, it may reach the target range of 1.2799-1.2814.


