Ethereum Continues The Up Move, Key Resistance Ahead
As the ETH/USD pair tests the 100 Moving Average (MA), the crypto market stands at a crucial juncture. This technical milestone poses the question: is a trend reversal on the horizon for Ethereum?
Key Takeaways
- Recent Price Movements: Ethereum has experienced a local high at $2,390, surpassing the 100 MA on the H4 time frame.
- Technical Support and Resistance: Intraday levels are identified at $2,240 and $2,412, marking critical points for future price action.
- Market Sentiment: A predominantly bullish sentiment prevails, with a significant majority expecting further upward movement.

Technical Market Outlook:
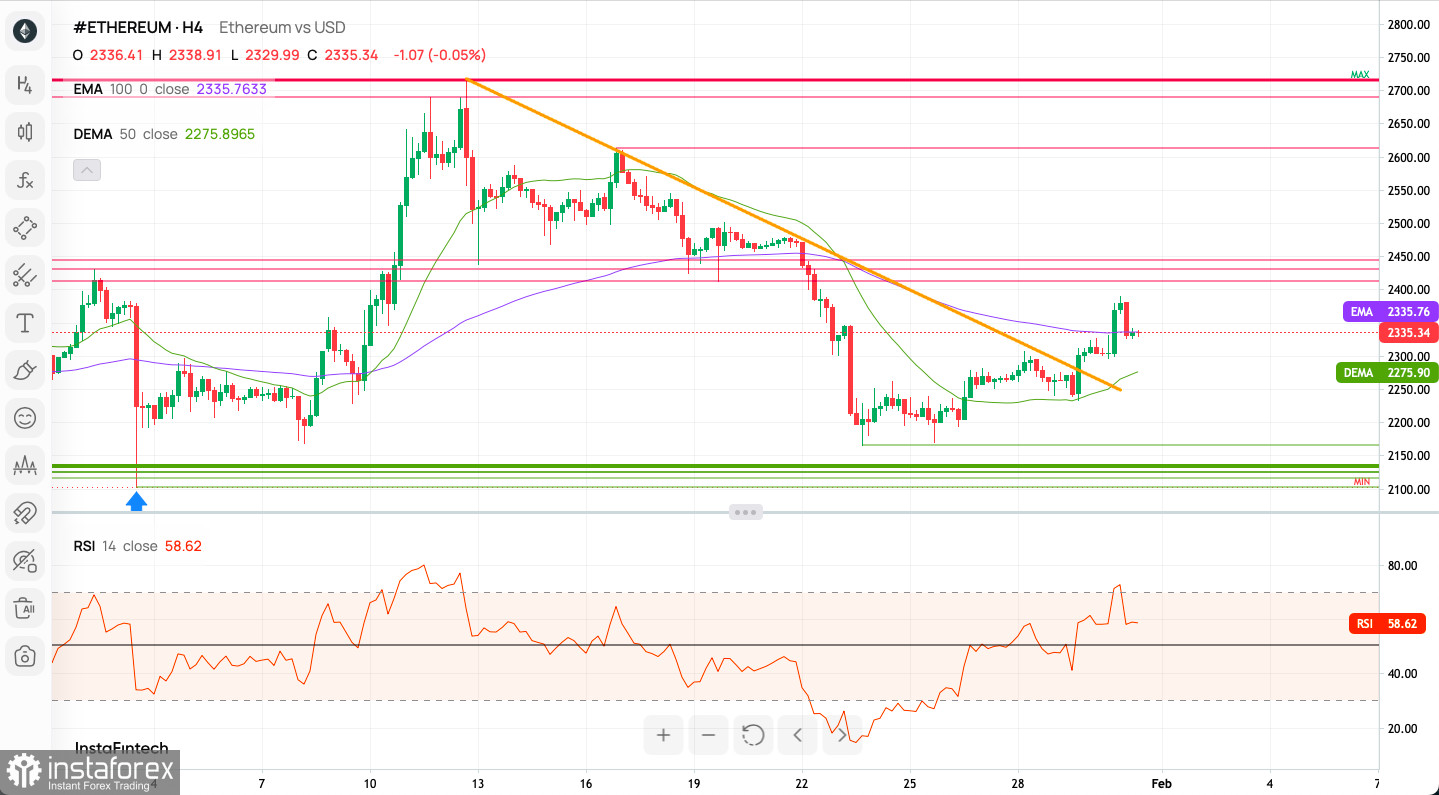
Following the capping of the rebound from the lows at $2,165, the ETH/USD pair reached a local high at $2,390. On the H4 time frame chart, the bulls have broken above the trend line resistance and moved swiftly higher over the 100 MA. The intraday technical resistance is at $2,412, which is the next goal for bulls, and the intraday technical support is at $2,240. It is time for a pullback, though, as the market is emerging from the very overbought conditions shown on the H4 time frame chart.
Technical Insights:
- Trend Lines: Ethereum's recent break through a descending trendline indicates potential trend reversal.
- Moving Averages: The price is above the 50-period DEMA and 100-period EMA, hinting at bullish momentum.
- Relative Strength Index (RSI): The RSI, at 58.62, suggests bullish momentum but remains shy of overbought territory.
Intraday Indicator Signals: ETH/USD 1H
- Technical Indicators: A mix of Sell, Buy, and Neutral signals, indicating a market in flux.
- Moving Averages: Majority signal a Buy, reinforcing the bullish outlook.
Sentiment Analysis: Market Mood
- Overall Sentiment: Bullishness prevails, with an increasing trend over the past week and three days.

Weekly Pivot Points: Critical Levels
- Upper Resistance (WR3 - WR1): $2,313 - $2,269
- Pivot Point: $2,258
- Lower Support (WS1 - WS3): $2,242 - $2,204
Bullish Scenario: Path to Continuation
- Key Indicators: Holding above the 50-period DEMA and 100-period EMA, coupled with a sustained break above the trendline.
- RSI Dynamics: An RSI above 50 moving towards 70 supports bullish momentum.
Bearish Scenario: Signs of a Pullback
- Warning Signals: A drop below key moving averages and RSI falling below 50.
- Trendline Retest: Failure to maintain above the previous descending trendline could signal a return to bearish trends.
Useful Links
Important Notice
The begginers in forex trading need to be very careful when making decisions about entering the market. Before the release of important reports, it is best to stay out of the market to avoid being caught in sharp market fluctuations due to increased volatility. If you decide to trade during the news release, then always place stop orders to minimize losses.
Without placing stop orders, you can very quickly lose your entire deposit, especially if you do not use money management and trade large volumes. For successful trading, you need to have a clear trading plan and stay focues and disciplined. Spontaneous trading decision based on the current market situation is an inherently losing strategy for a scalper or daytrader.


