


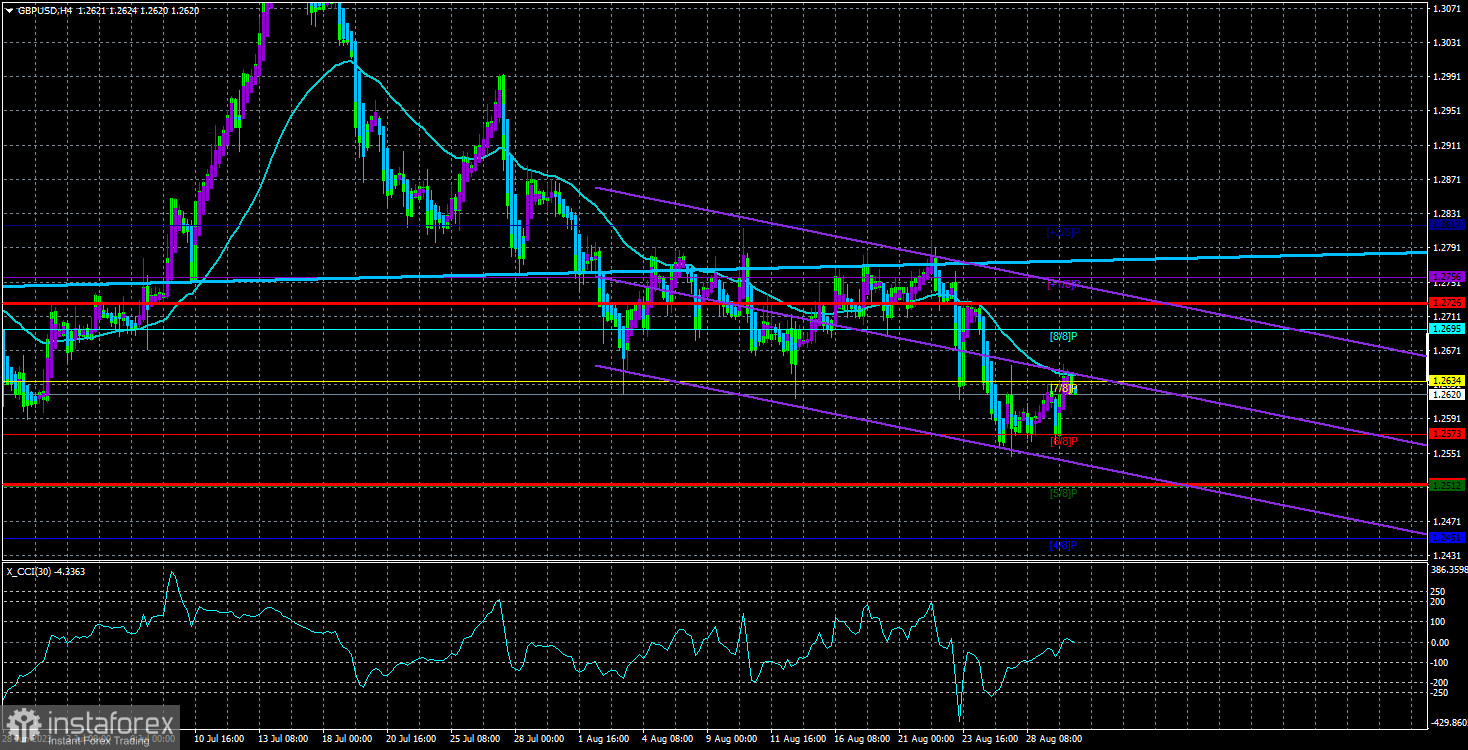
The GBP/USD currency pair also demonstrated an upward trend on Tuesday but was not as pronounced as the EUR/USD. The British pound failed to overcome the moving average line. Hence, the downward trend persists. A rebound from the moving average might trigger another decline, which, in our view, would be logical and justified anyway since the pound is still too high. However, several significant reports from the US this week could put pressure on the American currency. Therefore, it's essential to remember daily that the statistics from across the Atlantic might disappoint.
For instance, yesterday, we received a discouraging report on open vacancies in the US. It doesn't mean all other data will fail, but we can't know which reports will be weak or strong in advance. Therefore, an increase in the pound this week is entirely possible. But in the medium term, the trajectory is only downwards.
On the 24-hour timeframe, the pair hovers around the Senkou Span B line. The penultimate value of this line is stronger. Therefore, at this moment, it's premature to conclude about breaking through the Ichimoku cloud. And if so, the global upward trend can resume at any time. There is no fundamental or macroeconomic reasoning for this, as the American economy is in better shape than the British one. The market has already had the opportunity to react to the Bank of England's tightenings at least five times. However, this is the market, so movement can be illogical and inertial. In other words, one shouldn't short the pair "all in."
The ADP Report is analogous to Non-Farms but less crucial.
The ADP report on the number of employees in the private sector is a direct analog of the Non-Farm Payrolls. Yet, at the same time, it's the most contradictory report in the US. To begin with, its figures never match with Non-Farms. For instance, according to the ADP report, the number of employees in the non-agricultural sector might increase by 0.5 million, while the Non-Farm Payrolls might report an increase of 200,000. In the first case, market forecasts would be exceeded, and in the second, the actual figure would be below market expectations. Therefore, these reports should be considered separately and not attempt to draw any connection between them.
According to expert forecasts, ADP will show a value of 195 – 210 thousand today. Since forecasts and reality rarely coincide, a resonant figure can be expected from this report today. A resonant figure can provoke a significant movement in all pairs involving the dollar.
The second important report of the day is the US GDP for the second quarter in its second assessment. However, the "second assessment" makes this report secondary rather than primary. The first estimate can surprise traders, while the final one often revises the first and second. Hence, the second estimate is the least significant. As a result, we anticipate no market reaction to the GDP report. The focus should be on ADP.
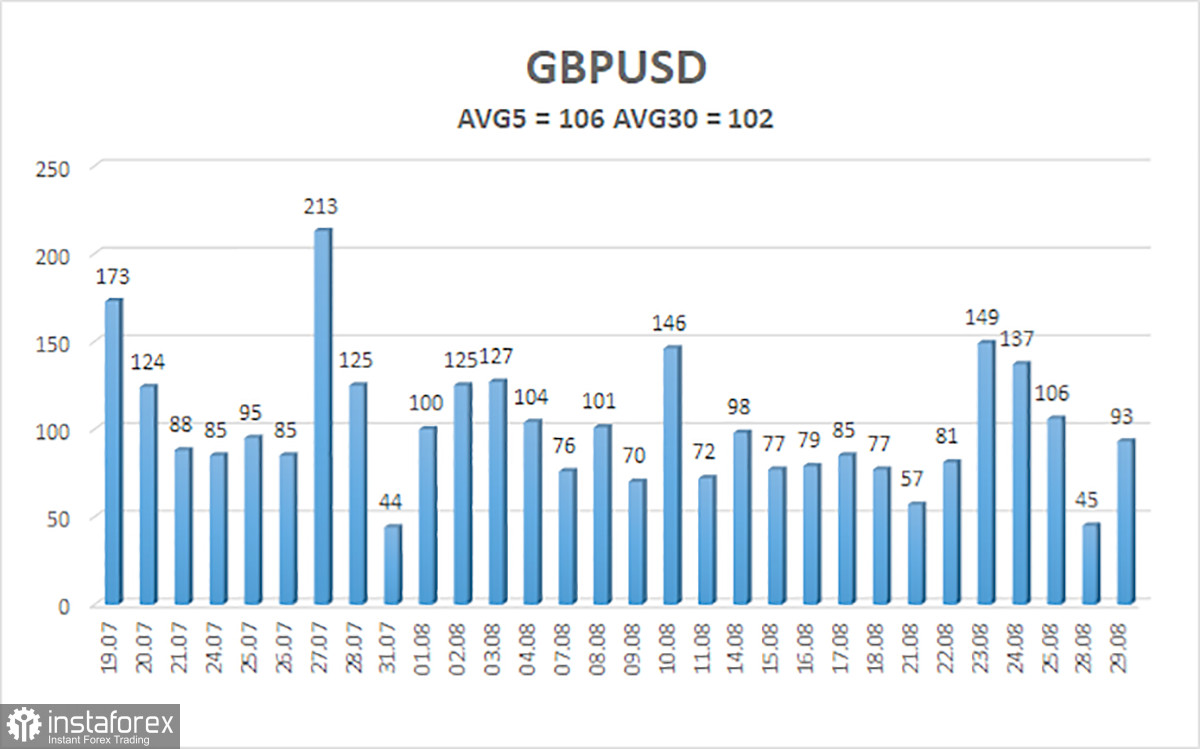
The average volatility of the GBP/USD pair for the last five trading days is 106 points. For the pound/dollar pair, this value is "average." Thus, on Wednesday, August 30, we expect movement within the range limited by levels 1.2514 and 1.2726. A downward reversal of the Heiken Ashi indicator signals a possible resumption of the downward movement.
Nearest support levels:
S1 – 1.2573
S2 – 1.2512
S3 – 1.2451
Nearest resistance levels:
R1 – 1.2634
R2 – 1.2695
R3 – 1.2756
Trading recommendations:
In the 4-hour timeframe, the GBP/USD pair resumed its downward trend. At this time, one should consider new short positions with targets at 1.2573 and 1.2514 in case of a downward reversal of the Heiken Ashi indicator or a price rebound from the moving average. Long positions can be considered no earlier than the price established above the moving average line, with targets at 1.2695 and 1.2726.
Illustration explanations:
Linear regression channels – help identify the current trend. If both point in the same direction, the trend is currently strong.
Moving average line (settings 20.0, smoothed) – determines the short-term trend and the current trading direction.
Murrey levels – target levels for movements and corrections.
Volatility levels (red lines) – the probable price channel in which the pair will trade in the next 24 hours, based on current volatility indicators.
CCI Indicator – its entry into the oversold area (below -250) or the overbought area (above +250) indicates an upcoming trend reversal in the opposite direction.


