


The most active and crucial trading period of the week starts for the dollar today.
Tomorrow, market participants will be monitoring the personal consumption expenditure statistics, and on Friday, a labor market report for August will be published. It is anticipated to show an increase of 170,000 new jobs in the non-agricultural sector (compared to 187,000 in July) and an unemployment rate remaining at 3.5%. The significant ISM Manufacturing Purchasing Managers Index (PMI) is expected to rise from 46.4 to 47.0 in August.
The report from Automatic Data Processing (ADP) on employment in the U.S. private sector, already published today, indicated a growth of 177,000 in August. The forecast had assumed an employment rise in the private sector of 195,000 (previous values: 324,000 in July, 455,000 in June, 267,000 in May, 291,000 in April, 142,000 in March, 261,000 in February, and 119,000 in January 2023).
However, even such a figure is still considered strong: economists estimate that the U.S. economy needs to create up to 150,000 new jobs monthly (outside the agricultural sector) to maintain labor market stability.
The dollar index responded with a short-term decline of about 10 points, and another 20 points due to the second estimate of the U.S. annual GDP, which turned out to be weaker than the first estimate (+2.1% against +2.4%) while maintaining positive dynamics overall.
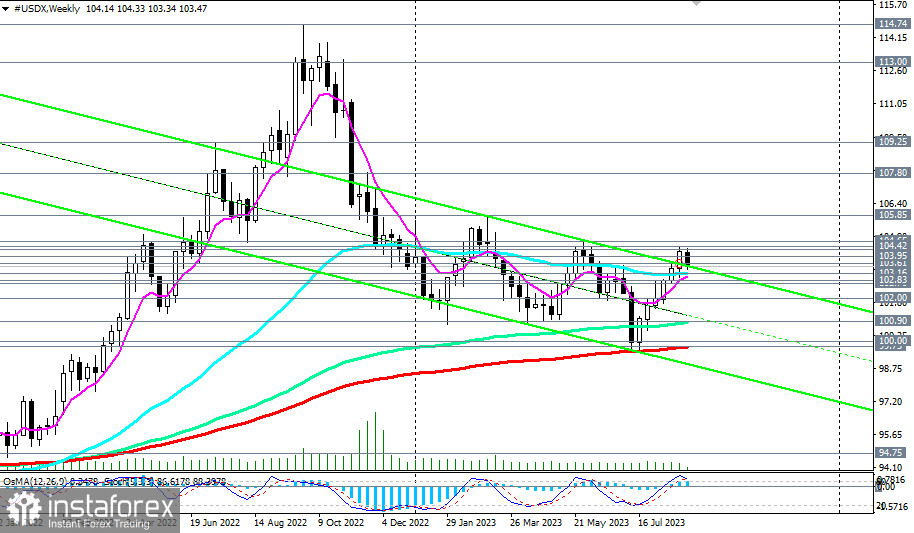
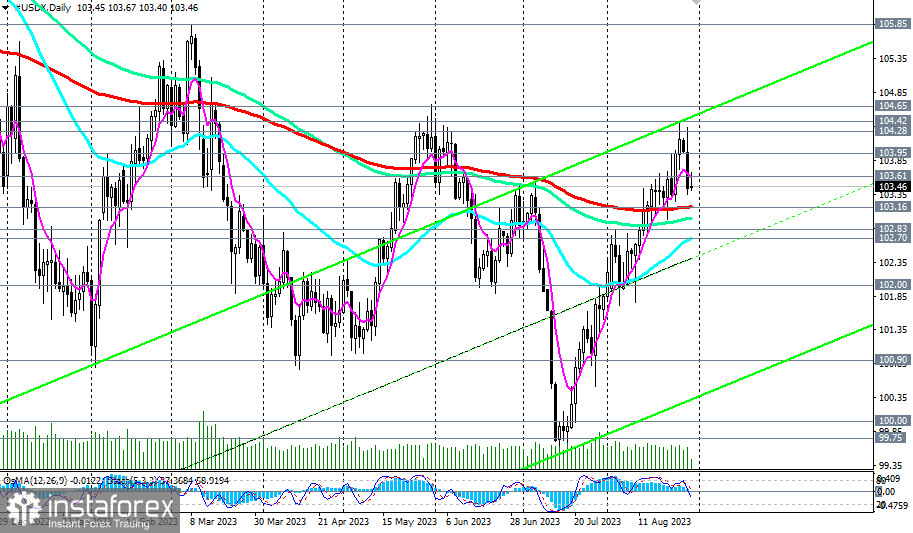
From a technical perspective, despite the decline, the dollar index DXY (CFD #USDX in the MT4 terminal) remains in the medium-term bullish market zone, above the key levels of 103.16 (200 EMA on the daily chart), 103.52 (upper boundary of the downward channel on the weekly chart), and in the long term—above the key levels of 100.00, 99.75 (200 EMA on the weekly chart).
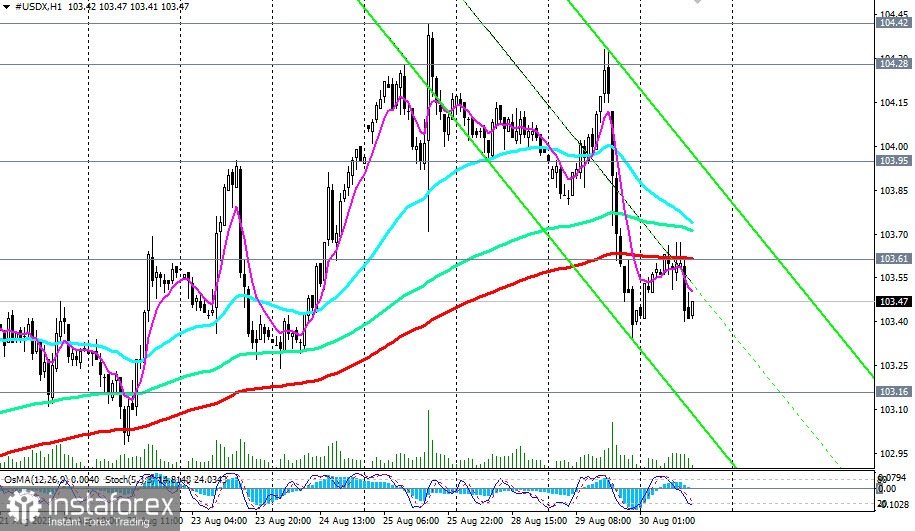
A breakout of the crucial short-term resistance level of 103.61 (200 EMA on the 1-hour chart) will signal the resumption of long positions, while a break of recent local highs of 104.28, 104.42, and the May high of 104.65 may signal an increase in long positions with a growth perspective to the March peak at 105.85.
In an alternative scenario, and after breaking below the key support level of 103.16 (200 EMA on the daily chart), the DXY will decline into the medium-term bearish market zone. A break of the significant support level of 102.70 (50 EMA on the daily chart) will signal a resumption of the DXY's downward momentum and short positions with targets at the key support levels of 100.90 (144 EMA on the weekly chart), 100.00. Breaking the key support level of 99.75 (200 EMA on the weekly chart) will put the DXY into the long-term bearish market zone.
Support Levels: 103.16, 103.00, 102.83, 102.70, 102.00, 101.00, 100.90, 100.00, 99.75
Resistance Levels: 103.61, 103.95, 104.00, 104.28, 104.42, 104.65, 105.00, 105.85.


