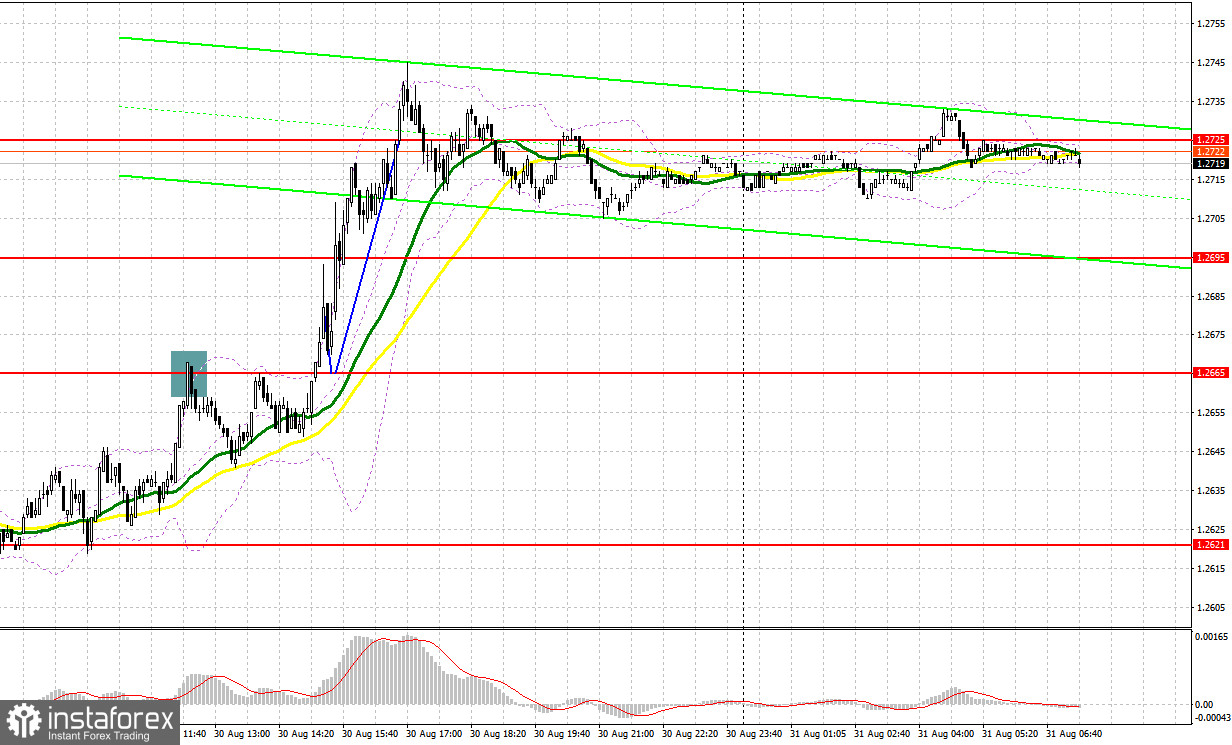
Several market entry signals were formed yesterday. Let's examine the 5-minute chart and delve into what happened there. In my morning review, I mentioned the level of 1.2640 as a possible entry point. The rise and a false breakout at this level created a sell signal, resulting in a 20-pip drop. After a breakout of 1.2640, the focus shifted to protecting 1.2665. A similar sell signal on this mark created another entry point, and the pair fell by another 25 pips. In the afternoon, I did not wait for any signals.

For long positions on GBP/USD:
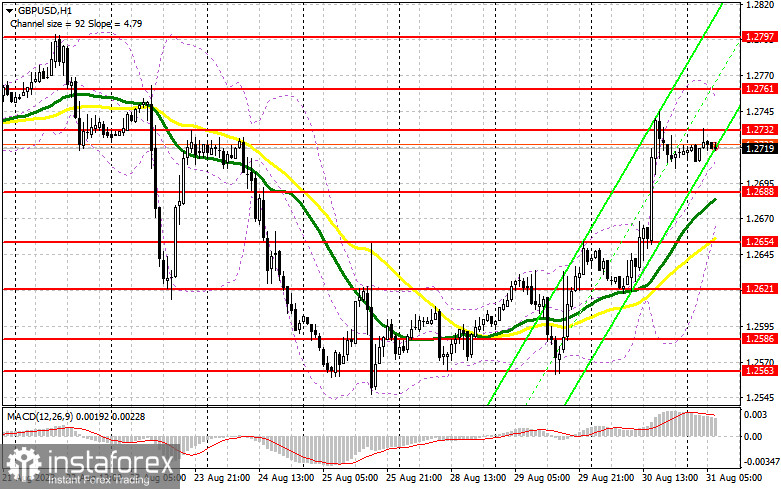
The pound rose in response to weak US economic reports, and it may extend this upward movement today. In the first half of the day, considering the fact that traders will only look to a scheduled speech by Bank of England Chief Economist Huw Pill and no other UK data, we can consider the possibility that the pair may correct to the nearest support at 1.2688. Currently, the area is marked by moving averages favoring bulls. In this case, I plan to act on a false breakout on this mark. This will provide an entry point into long positions with the prospect of a further recovery of GBP/USD to the Asian session's high of 1.273. The buyers will strengthen their confidence after a breakthrough and consolidation above this range. The odds will be for a climb to 1.2761. A higher target will be the area of 1.2797, where I will take profits. If the pair declines to 1.2688 with a lack of buyers in the market, which could happen during the US session, pressure on the pound sterling will return, as well as the probability of trading in a sideways channel. In this case, only protection of the next area 1.2654, as well as a false breakout on it, will give a signal to open long positions. I plan to consider buying the British currency on a bounce only from the low of 1.2621, allowing an intraday correction of 30-35 pips.
For short positions on GBP/USD:
It is very important for the bears not to let the pair climb above the resistance of 1.2732, formed on the basis of today's results. I will enter the market there only after an unsuccessful consolidation, which will give a signal to sell with the prospect of a decline to the area of 1.2688, a fairly large support that buyers are counting on. A break and reverse test from the bottom-up of this range will deal a more serious blow to the bulls' positions, providing an opportunity to make up for yesterday's growth and update 1.2654. A more distant target remains a low of 1.2621, where I will take profits. If the pair rises and we see weak trading at 1.2732, which is where things are heading, the buyers will retain full control over the market. In this case, I will postpone selling until a false breakout at 1.2761. If downward movement stalls there, one can sell the British pound on a bounce from 1.2797, bearing in mind a 30-35-pips downward intraday correction.

COT report:
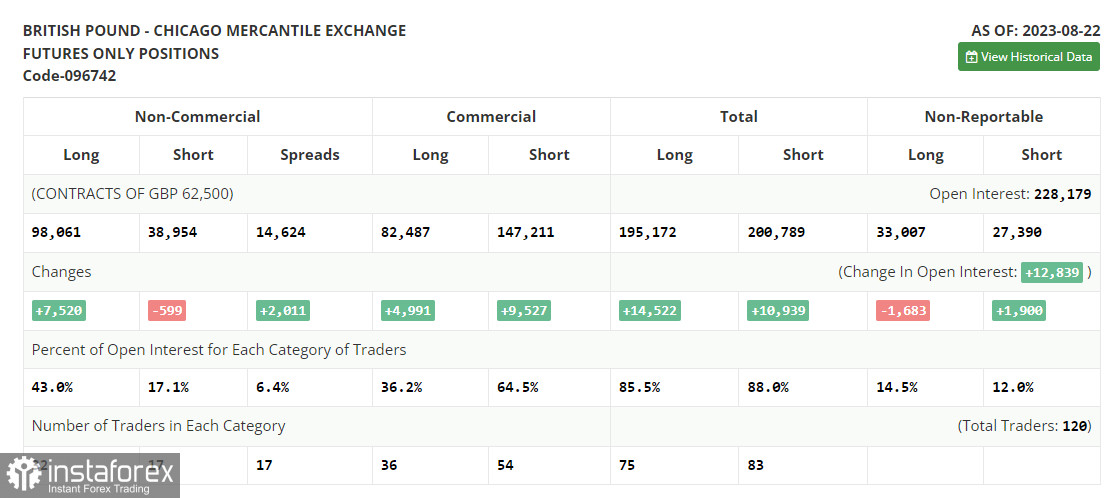
The COT report (Commitment of Traders) for August 22 logs an increase in long positions and a decrease in short ones. Traders continued to ramp up buying as the pound sterling declined after the recent decent UK GDP data. However, the whole picture was overshadowed by statistics on PMIs. Poor indices alongside the speech of Fed Chairman Jerome Powell that interest rates in the US will certainly be raised again created the conditions for the sterling to update one-month lows. However, the buyers took advantage of this very quickly. Indeed, the lower the pound, the more attractive it is for buying and holding in the medium term. The difference in the policies of central banks will continue to have a positive effect on GBP/USD. The latest COT report says that long non-commercial positions rose by 7,520 to 98,061, while short non-commercial positions decreased by 599 to 38,954. 1.2708. As a result, the spread between long and short positions jumped by 2,011. GBP/USD closed last week higher at 1.2741 against 1.2708 a week ago.

Indicator signals:
Moving Averages
Trading occurs above the 30- and 50-moving averages, indicating further pound growth.
Please note that the time period and levels of the moving averages are analyzed only for the H1 chart, which differs from the general definition of the classic daily moving averages on the D1 chart.
Bollinger Bands
If GBP/USD falls, the indicator's lower border near 1.2688 will serve as support.
Description of indicators:
• A moving average of a 50-day period determines the current trend by smoothing volatility and noise; marked in yellow on the chart;
• A moving average of a 30-day period determines the current trend by smoothing volatility and noise; marked in green on the chart;
• MACD Indicator (Moving Average Convergence/Divergence) Fast EMA with a 12-day period; Slow EMA with a 26-day period. SMA with a 9-day period;
• Bollinger Bands: 20-day period;
• Non-commercial traders are speculators such as individual traders, hedge funds, and large institutions who use the futures market for speculative purposes and meet certain requirements;
• Long non-commercial positions represent the total number of long positions opened by non-commercial traders;
• Short non-commercial positions represent the total number of short positions opened by non-commercial traders;
• The non-commercial net position is the difference between short and long positions of non-commercial traders.


