


Analyzing Thursday's trades:
GBP/USD on 30M chart
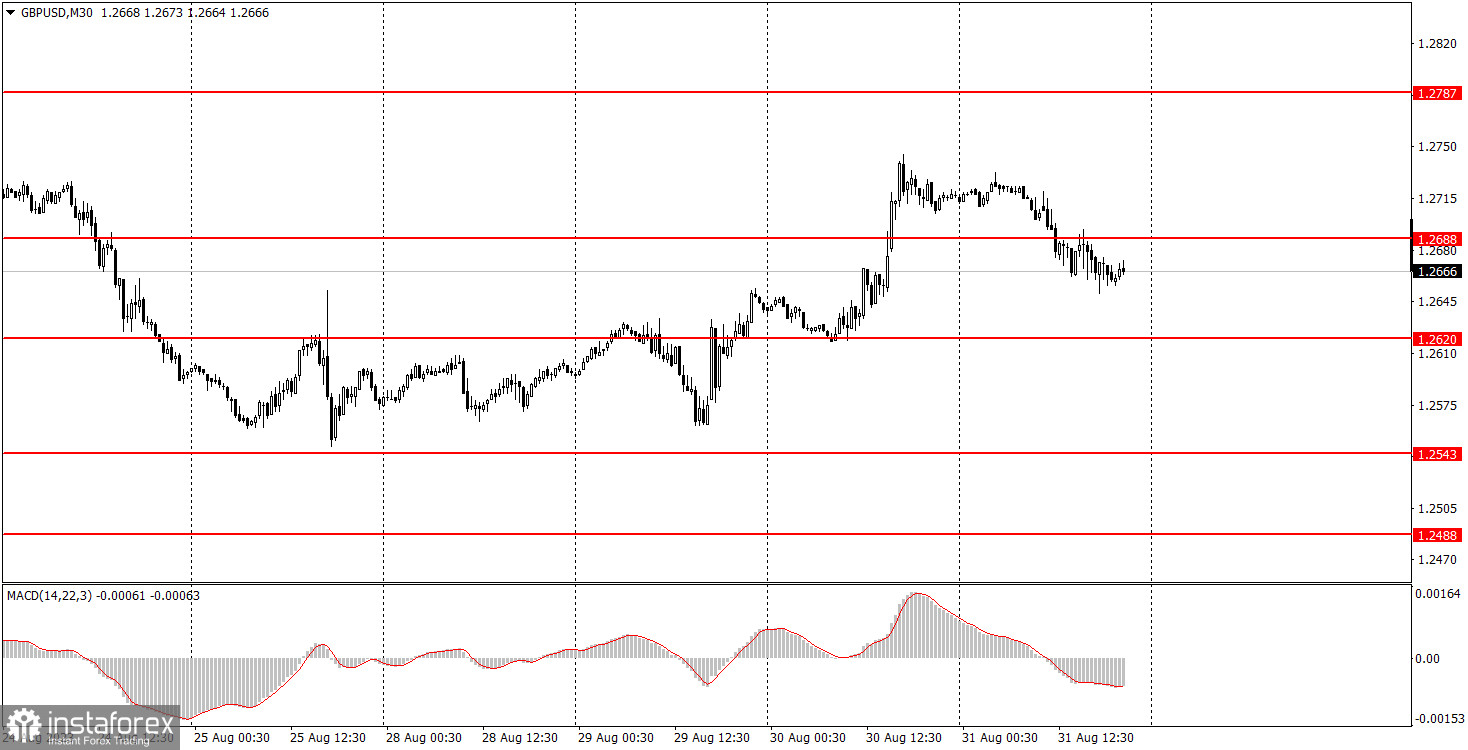
On Thursday, GBP/USD also started to correct lower. However, the European and German reports had no relation to the British pound, so this pair showed a weaker decline. Nonetheless, the pound sterling still traded lower. In addition to European data, the US also released several reports. The chart below shows that with the start of the US session, the pair began to actively move, although none of the listed reports were extremely important, and their values weren't resonating. The following data were published: the Personal Consumption Expenditure index, personal income and spending of the US population, and unemployment benefit claims. All these reports neither supported the dollar nor mounted pressure on it. They were neutral.
The most crucial day of the week is Friday when not just four reports will be published in the US but four significant reports: NonFarm Payrolls, unemployment, ISM index, and wages. Therefore, the pair can sharply move from side to side on Friday.
GBP/USD on 5M chart
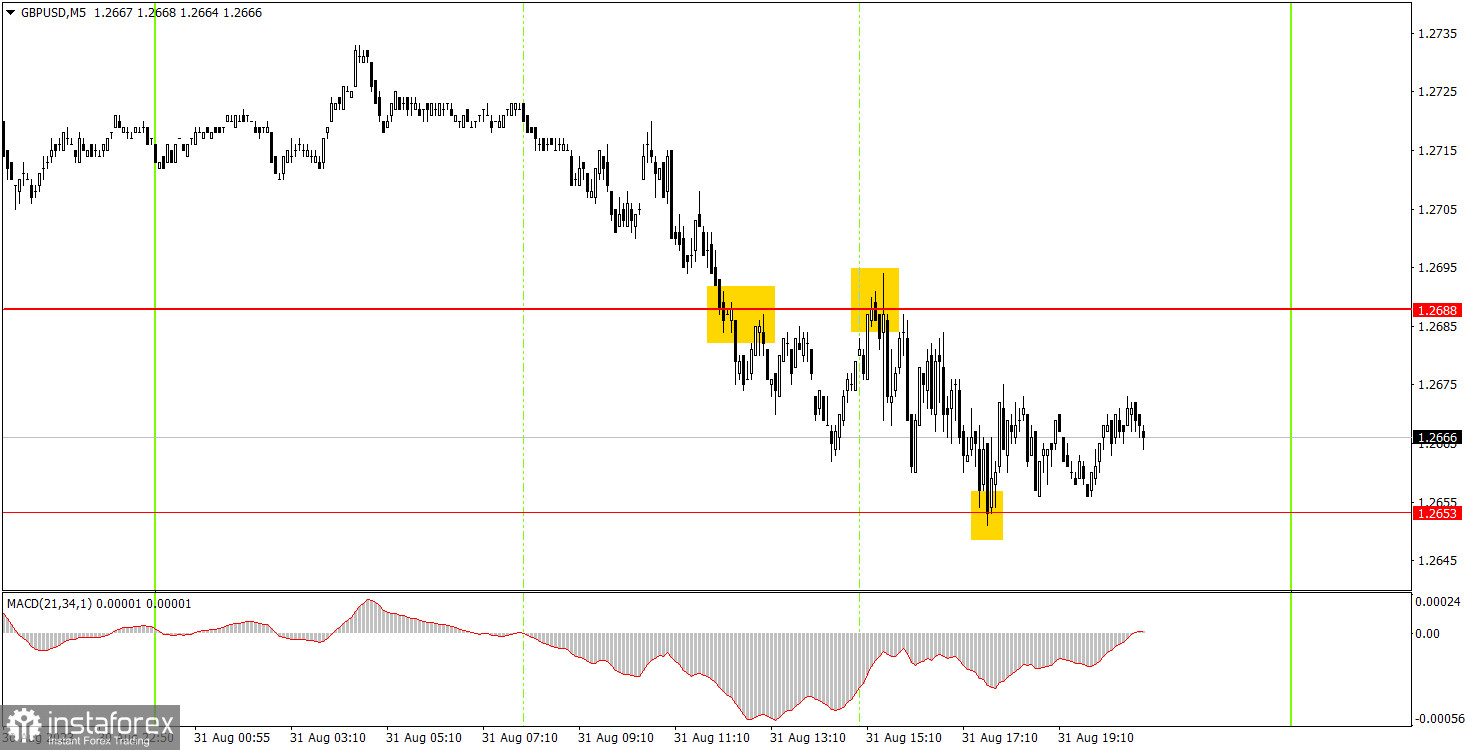
There were trends on the 5-minute chart, but it was also quite messy. There were few trading signals. The first one formed when the price overcame the 1.2688 level. After its formation, the price went down about 17 pips, which was not enough to set a Break-Even Stop Loss. Therefore, by the time the second sell signal formed around the same level, beginners had to stay in short positions. Eventually, the price fell to the nearest target level of 1.2653 and rebounded from it. At this point, you could close shorts and even open longs. The profit was about 15 pips, and with longs, you could earn another 5-10 pips.
Trading tips on Friday:
On the 30-minute chart, the GBP/USD pair also started a bullish correction influenced by the macroeconomic backdrop. We're still leaning towards a further decline in the British pound, believing it's currently overbought and unjustifiably pricey. So now we need to wait for the correction to end and the downtrend to return, which has already lasted one and a half months. The key levels on the 5M chart are 1.2457, 1.2488, 1.2543, 1.2605-1.2620, 1.2653, 1.2688, 1.2748, 1.2787-1.2791, 1.2848-1.2860. Once the price moves 20 pips in the right direction after opening a trade, you can set the stop-loss at breakeven. On Friday, no significant events lined up in the UK, but the US will release four important reports, which can have a significant impact on the movement of both major currency pairs.
Basic trading rules:
1) The strength of the signal depends on the time period during which the signal was formed (a rebound or a break). The shorter this period, the stronger the signal.
2) If two or more trades were opened at some level following false signals, i.e. those signals that did not lead the price to Take Profit level or the nearest target levels, then any consequent signals near this level should be ignored.
3) During the flat trend, any currency pair may form a lot of false signals or do not produce any signals at all. In any case, the flat trend is not the best condition for trading.
4) Trades are opened in the time period between the beginning of the European session and until the middle of the American one when all deals should be closed manually.
5) We can pay attention to the MACD signals in the 30M time frame only if there is good volatility and a definite trend confirmed by a trend line or a trend channel.
6) If two key levels are too close to each other (about 5-15 pips), then this is a support or resistance area.
How to read charts:
Support and Resistance price levels can serve as targets when buying or selling. You can place Take Profit levels near them.
Red lines are channels or trend lines that display the current trend and show which direction is better to trade.
MACD indicator (14,22,3) is a histogram and a signal line showing when it is better to enter the market when they cross. This indicator is better to be used in combination with trend channels or trend lines.
Important speeches and reports that are always reflected in the economic calendars can greatly influence the movement of a currency pair. Therefore, during such events, it is recommended to trade as carefully as possible or exit the market in order to avoid a sharp price reversal against the previous movement.
Beginners should remember that every trade cannot be profitable. The development of a reliable strategy and money management are the key to success in trading over a long period of time.


