


EUR/USD
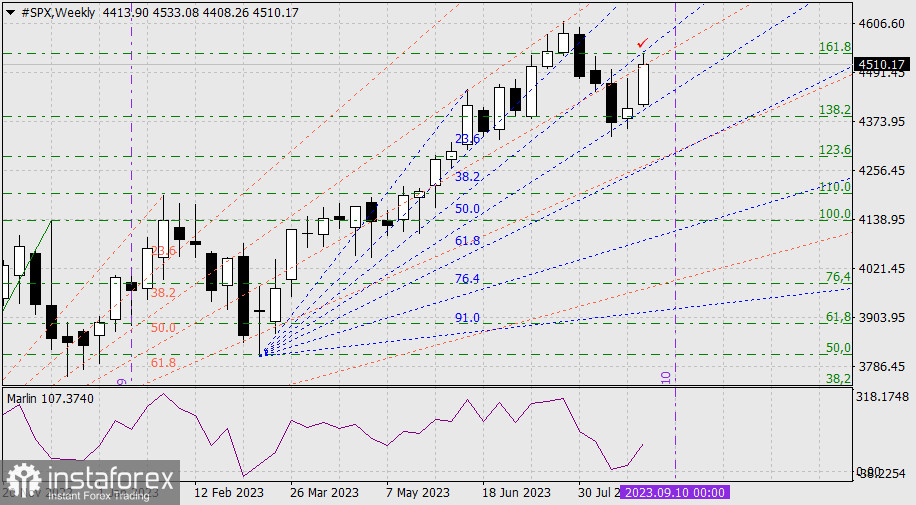
In the middle of the summer, we repeatedly mentioned that we expect a significant market reversal in conjunction with a decline in the stock market. In the review from July 26th titled "When will the stock market fall", we identified the S&P 500's turning point to be in the 2nd week of September. At the moment, the S&P 500 has already corrected more than 62% from the branch of decline from July 7th to August 18th. Yesterday, the S&P 500 fell by 0.16%, reaching the intersection point of the Fibonacci ray with the reaction level of 161.8% on a weekly time scale.
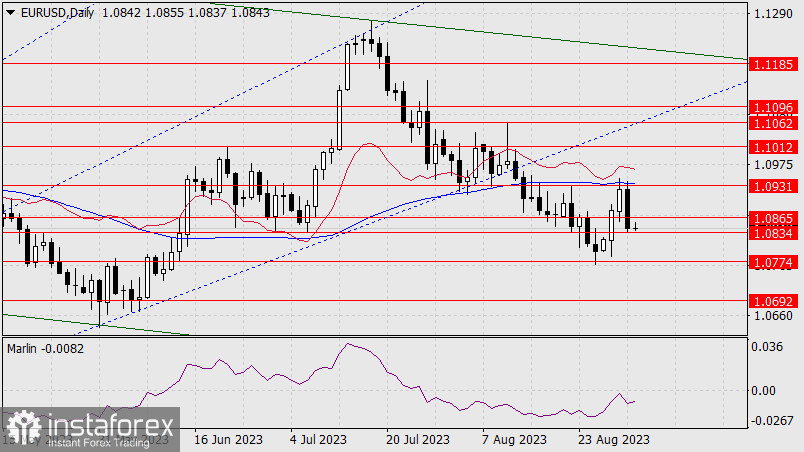
The euro plummeted almost 80 points upon reaching both the target level of 1.0931 and the MACD line on the daily chart. Is this the start of a synchronous fall?
Another way to phrase the question is: will the markets start to fall with today's US employment data, or during the week of the FOMC meeting of the Federal Reserve on September 20th? For purely technical reasons, the S&P 500 reversal falls during the week of the European Central Bank meeting on September 14th, so we can also expect an unexpected decision from this side as well.
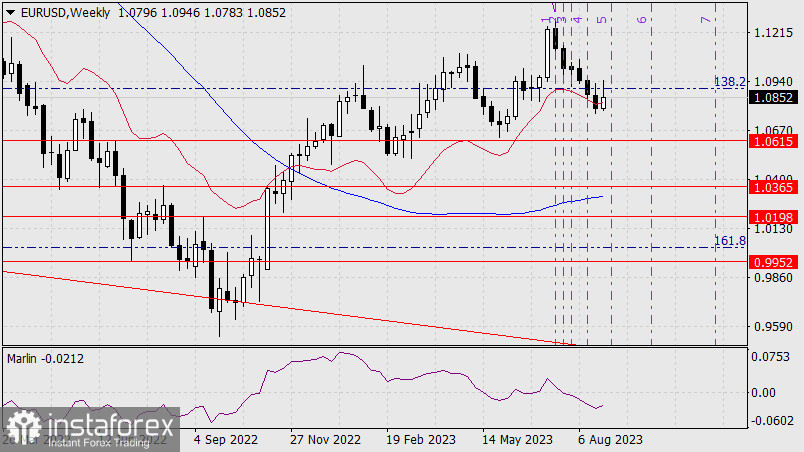
The weekly chart shows a reversal on the 5th Fibonacci timeline by next week. And since markets often lag one candle from the Fibonacci line, the euro's fall might coincide with the ECB meeting.
Therefore, the euro may rise today based on the weak US employment data we anticipate. Currently, the price is in quite a convenient range of 1.0834/65, from where traders might attack 1.0931. An alternative scenario could come into play once the price falls to 1.0774 (or even lower, to 1.0692) and from this level, it might move sideways in anticipation of the decisive moment.
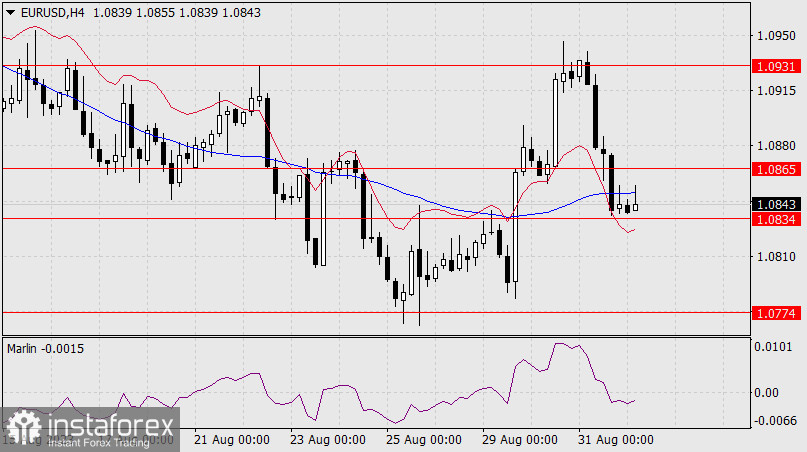
On the four-hour chart, the price has settled below the MACD line, and the Marlin oscillator has settled below the zero line. However, both of these signals might be short-lived or false, due to the price reversal from the 1.0834 support. The situation is ambiguous, and even with the release of US employment data, we will not rush to conclusions.


