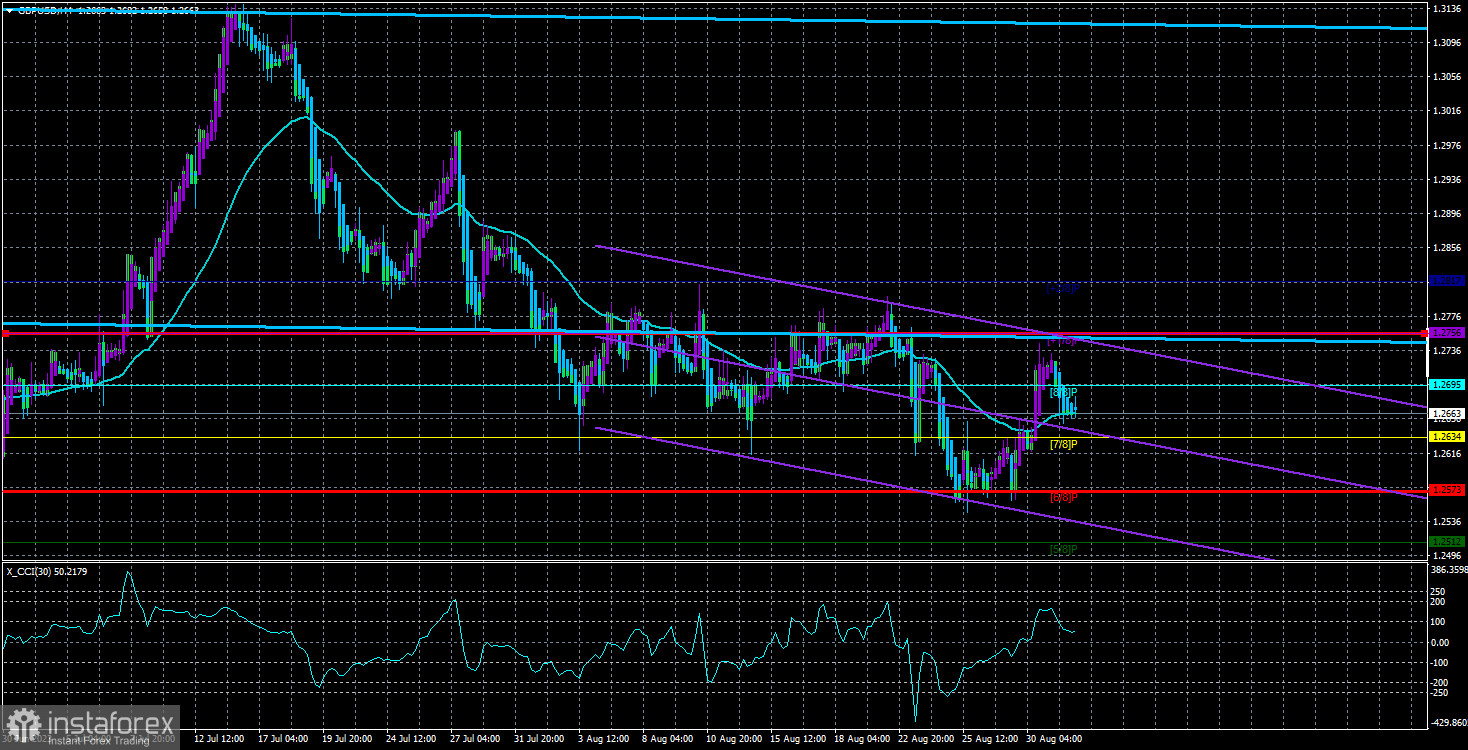
On Thursday, the GBP/USD currency pair also showed a downward movement but failed to stabilize below the moving average. From a technical perspective, the growth of the British currency could well resume today. However, it's worth noting that this week has a very strong macroeconomic background, and Friday is no exception. At least three crucial US reports will be released today, which could send the pair soaring or plummeting by hundreds of points. Hence, discussing the immediate prospects right now could be more meaningful. We must get through today and then draw technical conclusions in a milder setting.
The 24-hour timeframe paints a picture almost identical to the EUR/USD pair. The price has risen to the Senkou Span B line (to its last value) and even bounced off. This means we have a formally ascending trend in the 4-hour timeframe and a formally descending trend in the 24-hour timeframe. "Formally," because the price hasn't solidified below the previous value of Senkou Span B (at the 1.2573 level). This particular value should be used to determine the trend and as a signal to change it. After today, the pair could end up anywhere, so we need to reassess the technical picture.
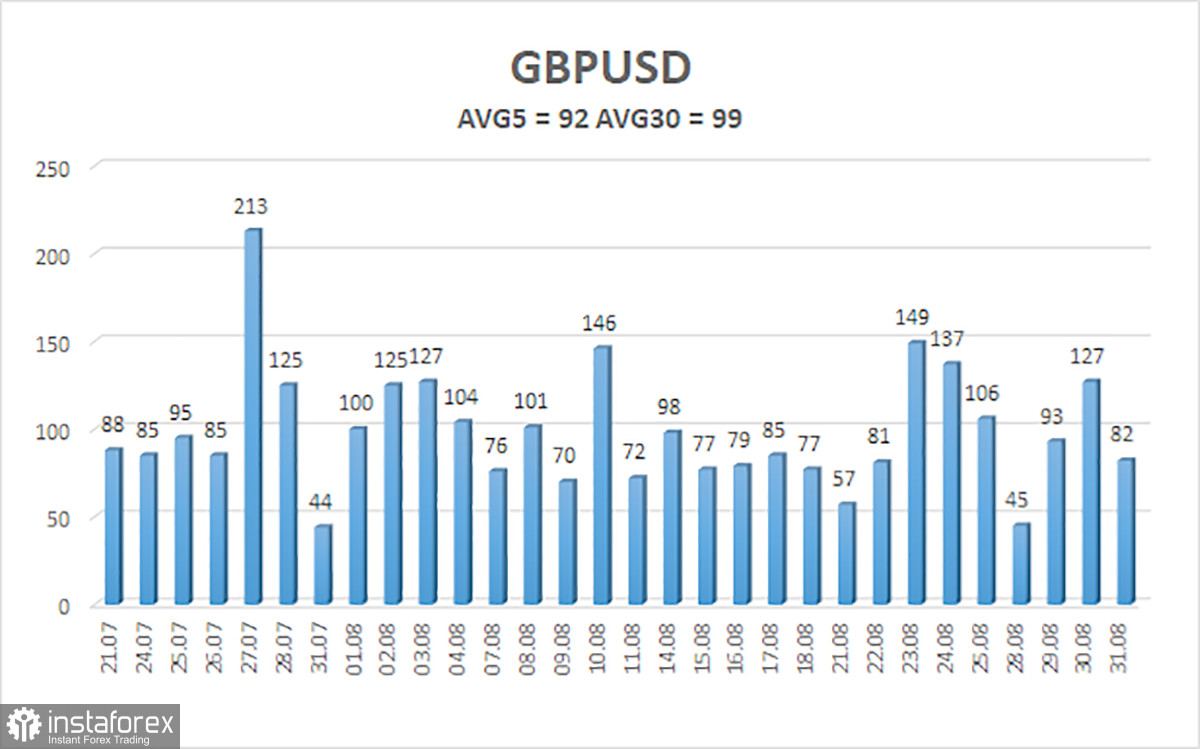
Interestingly, yesterday's volatility of the British currency wasn't particularly strong - just 80 points. European statistics didn't impact the pound, and macroeconomic data from across the ocean came in neutral and wasn't the most crucial. Thus, expecting market reactions to these reports without notable value was naive. No reactions followed. However, today promises to be quite interesting.
Three scenarios with equal probabilities.
Today, the Nonfarm Payrolls, unemployment rate, wages, and ISM manufacturing index will be published in the US. We can ignore the wage report since the other three publications will overshadow it. Nonfarm Payrolls and unemployment will be released first, followed by the ISM index an hour and a half later. Hence, the market will react to nonfarm payrolls and unemployment.
The combined outcome of these two publications can vary. If we examine recent changes in unemployment, it's evident that it hardly grows and remains relatively stable with minor fluctuations. Nonfarm payrolls have been declining on average for over a year. Hence, we expect a slight deviation from the 3.5% unemployment rate, which shouldn't surprise the market. However, any value can be expected from NonFarm Payrolls. The key is to quickly determine whether the forecast was exceeded and whether the previous month's value was revised. We can anticipate the dollar's growth if the data is stronger and unemployment hasn't plummeted. If the data is weaker and unemployment hasn't dropped to 3.3%, we should expect a decline in the American currency.
And the ISM Business Activity Index may complete the Friday picture in just an hour and a half. This index is expected to rise to 47 points, which is unlikely to trigger a strong market reaction if the forecast comes true. If it doesn't, the size of the discrepancy and the direction of deviation will matter. In simple terms, after the first two reports, we might see a sharp rise in the dollar, and after the ISM, its decline. Thus, the pair's movement direction today may change several times.

The average volatility of the GBP/USD pair over the last five trading days is 92 points. For the pound/dollar pair, this value is "average." On Friday, September 1st, we expect movement within the range limited by levels 1.2572 and 1.2756. A reversal of the Heiken Ashi indicator upwards will signal a possible resumption of the upward movement.
Nearest support levels:
S1 – 1.2634
S2 – 1.2573
S3 – 1.2512
Nearest resistance levels:
R1 – 1.2695
R2 – 1.2756
R3 – 1.2817
Trading recommendations:
The GBP/USD pair in the 4-hour timeframe has consolidated above the moving average. Thus, at this time, one should consider new long positions with targets at 1.2756 and 1.2817 in case of a bounce from the moving average or a Heiken Ashi turnaround upwards. However, it's important to remember that a decline may continue if the macroeconomic background supports it. Short positions can be considered not before the price is firmly below the moving average line, targeting 1.2573 and 1.2512.
Explanations for the illustrations:
Linear regression channels – help determine the current trend. If both are directed in one direction, the trend is strong.
The moving average line (settings 20.0, smoothed) – determines the short-term trend and the direction in which trading should occur.
Murrey levels – target levels for movements and corrections.
Volatility levels (red lines) – the likely price channel the pair will spend the next day, based on current volatility indicators.
CCI indicator – its entry into the oversold area (below -250) or the overbought area (above +250) means that a trend reversal in the opposite direction is approaching.


