Long-term perspective.

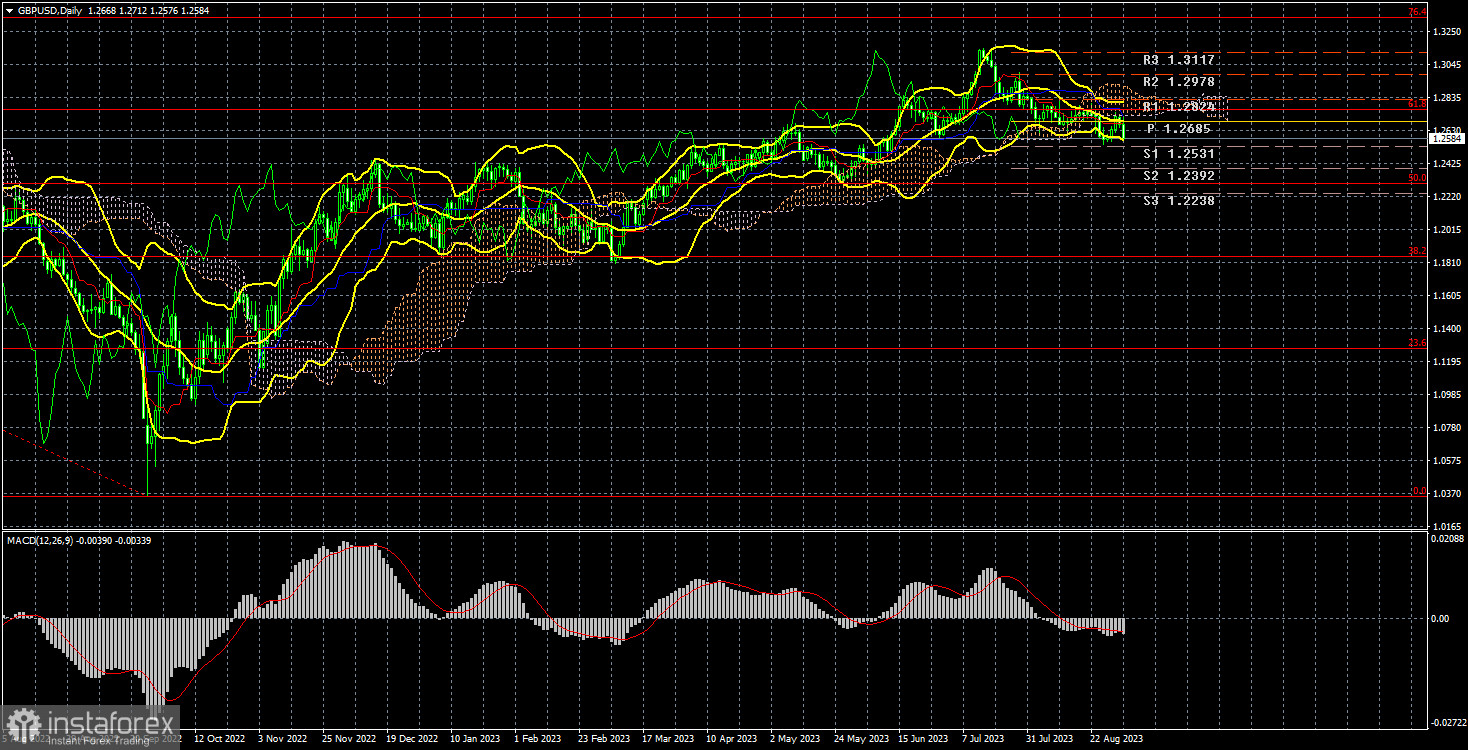
During the current week, the GBP/USD currency pair also corrected towards the Ichimoku Cloud and then attempted to resume its downward movement, which has been forming over the past one and a half months. However, there are significant differences between the euro and the pound movements. First, the euro has settled below the Ichimoku Cloud, while the pound has not. Second, the pound continues to weaken against the dollar at a slower pace and strengthens more effectively. Thus, the first conclusion is that a trend change is looming for the British currency, but the market is much more hesitant about selling the pound than the euro.
Let's remind ourselves that we consider the second-to-last value as the Senkou Span B line, not the latest one. This week's macroeconomic statistics for the British pound were almost the same as for the euro. The only difference is in the inflation report released by the European Union. However, this report can be interpreted differently, and there is no certainty that the euro declined solely because of it.
The weaker decline in the British currency is related to market expectations regarding interest rates. The ECB is not expected to make significant moves right now, as some members have openly discussed the possibility of ending the tightening cycle. This was also evident from the ECB's recent meeting minutes published this week. However, there are no such expectations for the Bank of England. More precisely, there may be expectations, but there is no basis for them. All of the Bank of England representatives have yet to hear that the regulator is preparing for a pause or the end of its cycle. Therefore, the market is still expecting more from the BoE.
The market has already priced in all BoE's interest rate hikes. Still, at the same time, it is being cautious, anticipating that the regulator may tighten its stance even further, especially considering that inflation remains high in the UK. However, we expect declines for both the euro and the pound overall.
COT Analysis.

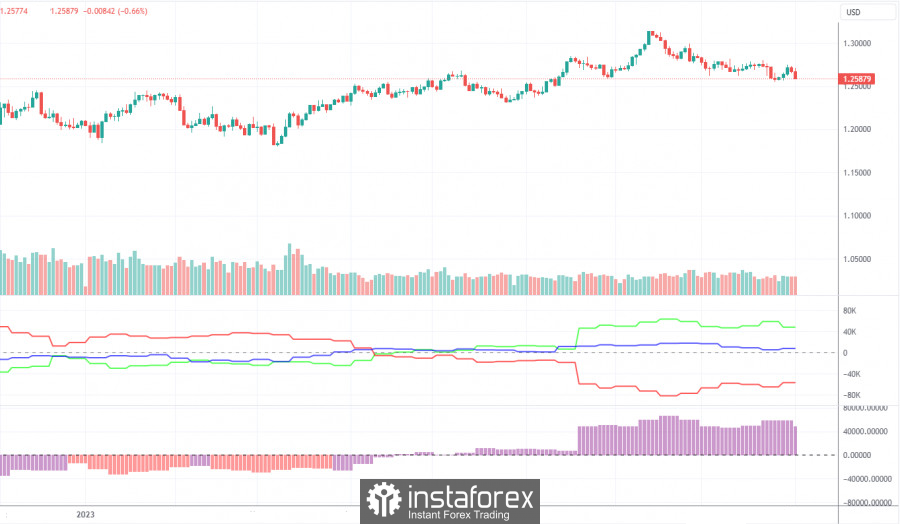
According to the latest report on the British pound, the "Non-commercial" group closed 0.9 thousand buy contracts and opened 9.8 thousand sell contracts. Consequently, the net position of non-commercial traders decreased by 10.7 thousand contracts in one week. The net position indicator has steadily risen over the past 11 months and remains high. The British pound (in the long-term perspective) has been rising alongside it. We are approaching a moment when the net position has increased too much to count on the pair's continued rise. A prolonged and protracted decline of the pound is about to begin. COT reports allow for a slight strengthening of the British currency, but with each passing day, it becomes increasingly difficult to believe in it. Identifying the basis on which the market could resume buying is very challenging. Sell signals are starting to appear on the 4-hour and 24-hour timeframes.
The British currency has risen by 2800 points from its absolute lows reached last year, a significant amount. With a strong downward correction, continuing this rise would be entirely logical. We are not against an upward trend; we believe a substantial correction is needed first. The market's perception of the fundamental backdrop is one-sided: many factors favoring the dollar are disregarded. The "Non-commercial" group currently holds 97.0 thousand contracts for buying and 48.7 thousand for selling. We remain skeptical about the long-term rise of the British currency, and the market has recently paid little attention to selling.
Fundamental Events Overview:
There were few fundamental events this week, and there were none at all in the UK. All market attention was focused on macroeconomic reports, but in the first half of the week, they were negative for the dollar, and in the second half, they were mixed. In general, if the dollar had significantly declined at the end of this week, we would not have been surprised because there were indeed grounds for it. However, the fact that the US currency managed to rise on Friday when the macroeconomic backdrop was not in its favor may indicate the onset of a downward trend. If the Bank of England does not spoil everything with a hawkish stance, we continue to expect declines from the pound.
Trading Plan for the Week of September 4th to 8th:
- The GBP/USD pair is attempting to form a new correction. Each new attempt to correct lower has looked feeble, but we may see it move below the Ichimoku Cloud this time. The price is currently positioned below all the lines of the Ichimoku indicator, so long positions are irrelevant. If the price consolidates above the Kijun-sen line, it would indicate a possible resumption of the upward trend. The target is the 76.4% Fibonacci level at 1.3330 in this case.
- As for selling, there are currently grounds for it, but we still need to be confident about breaking below the Senkou Span B line. Therefore, selling is possible and necessary, as reversal signals have been forming lately, but one should be cautious. The nearest target is the 50.0% Fibonacci level at 1.2302.
Explanations for the illustrations:
Price support and resistance levels, Fibonacci levels - these are the targets when opening buy or sell positions. You can place Take Profit levels near them.
Indicators used: Ichimoku (standard settings), Bollinger Bands (standard settings), MACD (5, 34, 5).
Indicator 1 on the COT charts - the size of the net position for each trader category.
Indicator 2 on the COT charts - the size of the net position for the "Non-commercial" group.


