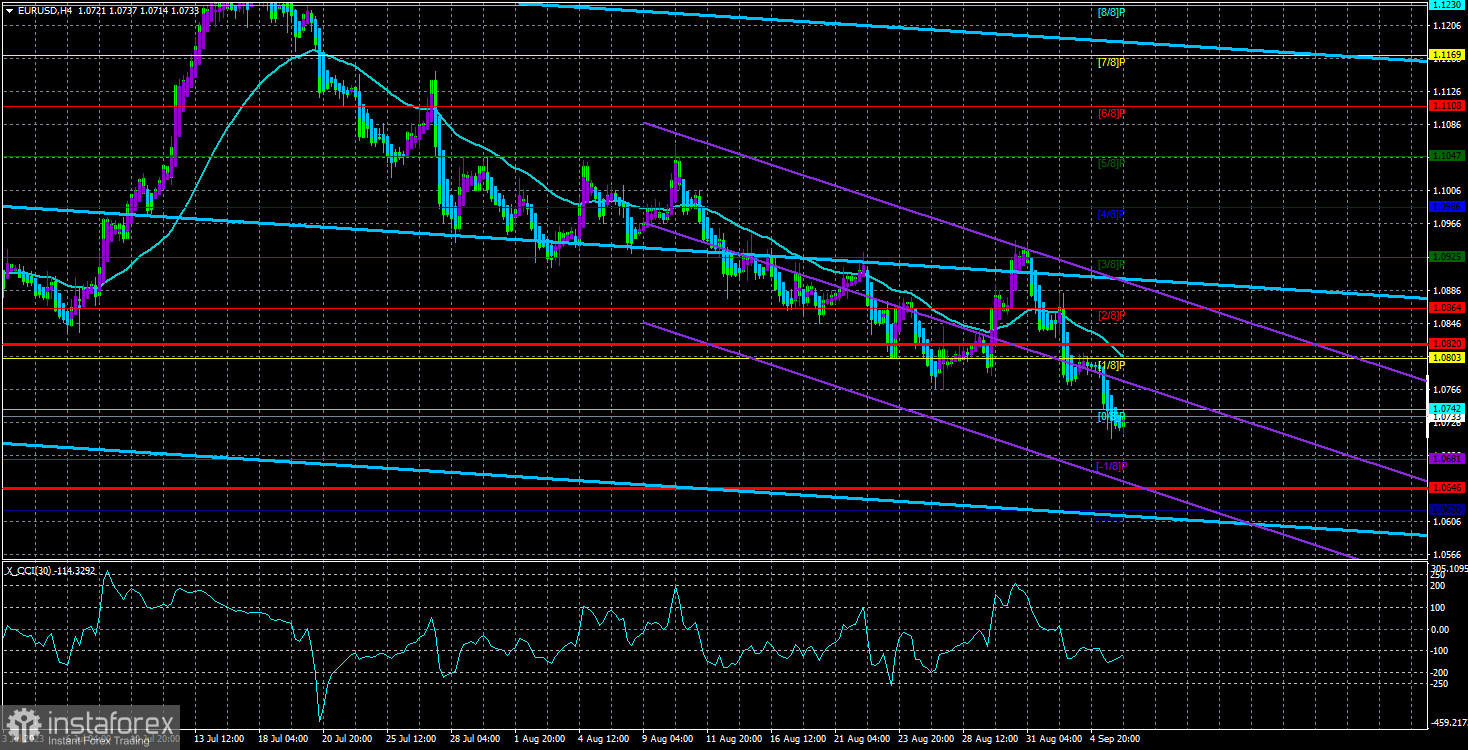
The currency pair EUR/USD sharply and somewhat unexpectedly resumed its downward movement during the second trading day of the week. Yesterday's macroeconomic backdrop was rather weak, but a few fundamental events could have triggered a market reaction. We're talking about the statements of the ECB's monetary committee representatives. While we don't have information on all the interviews, we can confidently say that the market did not get the hawkish rhetoric it was waiting for. Therefore, the European currency was under pressure throughout Tuesday and continues to move lower, in line with our expectations.
It's worth recalling that for several consecutive months, we have been forecasting a decline in the euro, at least to the 1.0609 level. At the moment, there are only 130 points left to reach this area. Since there have been no significant reasons for the euro to appreciate recently, the southward movement will continue. Last week's macroeconomic statistics from across the ocean were disappointing. Therefore, the euro had an excellent opportunity to climb higher. However, an illogical decline followed on Thursday and Friday, which didn't recover on Monday as we expected. Therefore, the conclusion is evident: the market is bearish, and traders don't necessarily need downward factors to sell.
In the 24-hour timeframe, the picture is excellent. The Ichimoku cloud has been overcome, so nothing prevents the pair from moving towards the Fibonacci level of 38.2% at 1.0609. We consider this level to be a minimum target. In 2023, the euro appreciated, but growth noticeably slowed down. The market needed to understand the factors driving the need to buy the pair.
Even with the disappointing US statistics from last week, this data is much stronger than that in the European Union. The Fed's interest rate is significantly higher than the ECB's rate. The US GDP growth is +2.1%, while the EU's strong GDP growth is only +0.3%.
Christine Lagarde didn't even try to support the euro.
Yesterday, we mentioned that Christine Lagarde did not respond to a journalist's question about the ECB's interest rate decision at the September meeting, which could have triggered a wave of euro selling on Tuesday. This year, the euro and the pound have risen based solely on market expectations of tighter policies in the EU and the UK compared to the US. But as we can see, the ECB has no plans to raise its rate to 6% and has already sent clear signals of an impending end to the tightening cycle.
The more the market realizes that another 1-2 rate hikes are the maximum for the ECB, the fewer growth factors remain for the euro. What factors could there be now? The Eurozone's economy is weaker, the interest rate is lower, and prospects for rate hikes are quite modest. Yes, by the end of the year, the US dollar could come under pressure as US inflation slows down to 3.2%, meaning that there will be no need to keep rates at their highest level for much longer. Powell's and other FOMC representatives' dovish rhetoric could trigger a wave of US dollar sales. However, the rate-cutting process in America will take at least a year, if not longer. Sooner or later, the ECB will also start considering lowering its key rate.
Therefore, by the end of the year, the euro may gain a slight advantage, but it's unlikely to lead to a global upward trend recovery. A recession in the EU is also possible, and the fight against inflation may drag on for the next 2.5 years. What will happen in the world during this time is not worth considering, as the last few years have been crazy.

The average volatility of the EUR/USD currency pair over the last 5 trading days as of September 6th is 87 points and is characterized as "high." Thus, we expect the pair to move between the levels of 1.0646 and 1.0820 on Wednesday. A reversal of the Heiken Ashi indicator upwards will indicate a new phase of an uptrend correction.
The nearest support levels:
S1 – 1.0681
S2 – 1.0620
The nearest resistance levels:
R1 – 1.0742
R2 – 1.0803
R3 – 1.0864
Trading recommendations:
The EUR/USD pair has fallen below the moving average and continues to decline. Short positions can be maintained with targets at 1.0681 and 1.0646 until the Heiken Ashi indicator reverses upward. Long positions can be considered if the price consolidates above the moving average line, with targets at 1.0864 and 1.0925.
Explanations for the illustrations:
Linear regression channels – help determine the current trend. If both point in the same direction, the trend is currently strong.
The moving average line (settings 20.0, smoothed) – determines the short-term trend and the direction for trading.
Murray levels – target levels for movements and corrections.
Volatility levels (red lines) – the likely price channel in which the pair will trade over the next day, based on current volatility indicators.
CCI indicator – its entry into the overbought region (above +250) or oversold region (below -250) indicates that a trend reversal in the opposite direction is approaching.


