EUR Retrace 50% And Reverse, Bears Still In Control
Morning Brief:
Today's macroeconomic calendar lacks key releases that could sway global markets significantly. Futures contracts suggest minimal volatility at the opening of the European cash session, with most instruments showing changes within a narrow range of 0.10%. Attention will be on speeches from central bankers of the ECB and the Fed, as well as earnings reports from several US companies post-session.

Central bankers' speeches throughout the day include:
- 9:00 GMT ECB de Cos
- 10:45 GMT ECB Lane
- 14:00 GMT BoE Bailey
- 14:15 GMT ECB Lane
- 16:50 GMT ECB Cipollone
- 18:00 GMT Fed Barkin
- 19:00 GMT Fed Kashkari
- 19:00 GMT BoE Bailey
- 22:00 GMT RBA Kohler
Looking ahead, the focus shifts to the US inflation report, with expectations leaning towards a decline. Subsequent days will bring crucial data like retail sales and industrial production, influencing the Fed's March decision.
Technical Market Outlook:
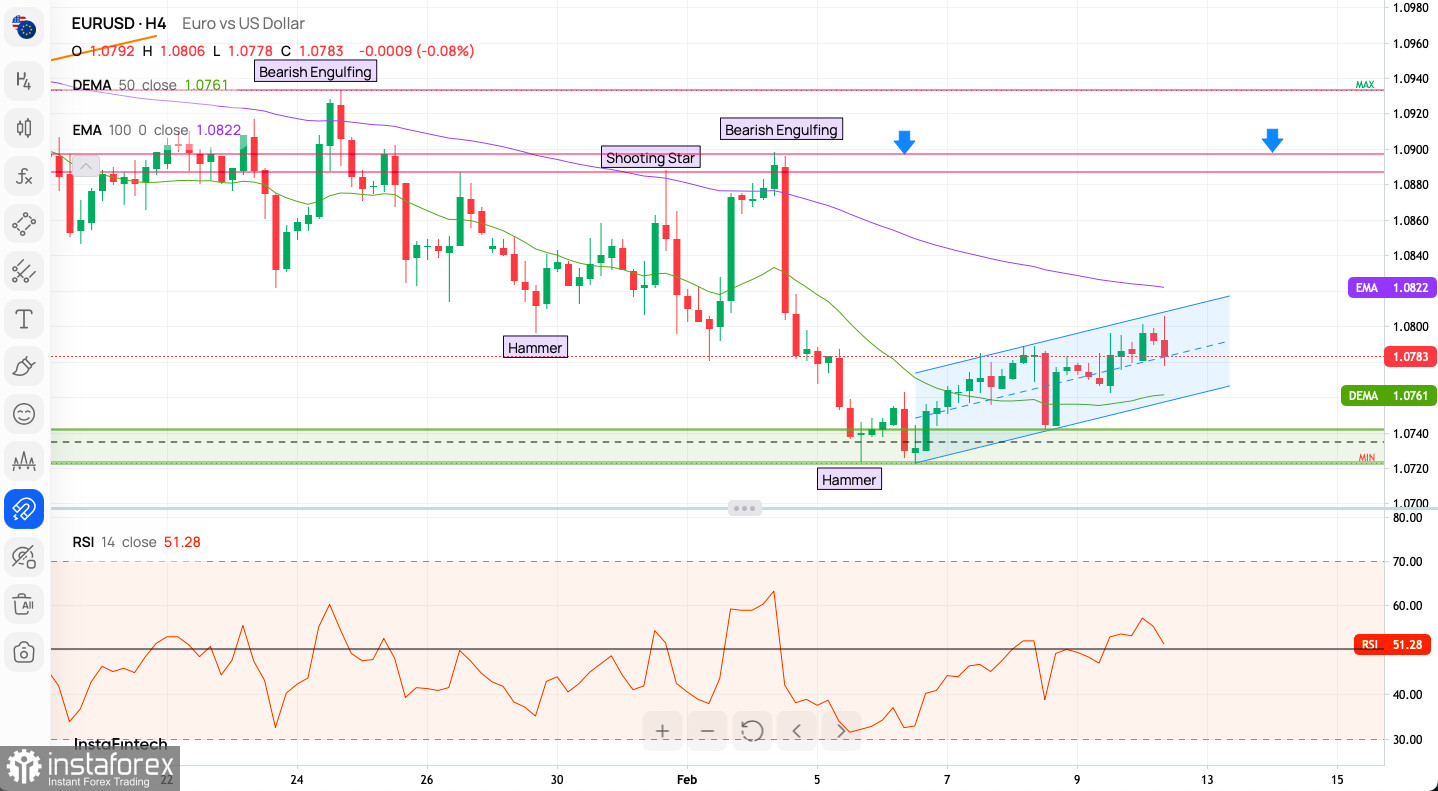
The EUR/USD pair's bounce is capped near 1.0806, just shy of the 50% Fibonacci retracement level, while the upside faces resistance at 100 DEMA around 1.0822. Intraday support lies at 1.0763. Momentum indicates a market rebounding from oversold conditions, with a pivotal test near the fifty level. Bullish momentum requires a breakout above 1.0810, targeting the key short-term supply zone at 1.0898 - 1.0890.
H4 Time Frame Technical Insights:
Candlestick Patterns: 'Hammer' patterns at lower levels suggest potential bullish reversals, contrasted by a 'Shooting Star' at higher levels indicating possible bearish reversals. Instances of 'Bearish Engulfing' patterns further hint at bearish sentiment.
Moving Averages: The 50-period DEMA and 100-period EMA form potential resistance and support zones, respectively, with the price currently situated between them.
Technical Indicators: The RSI around 51.28 signals neutrality, suggesting neither overbought nor oversold conditions.
Trendlines and Price Channels: The price is within an ascending channel, indicative of a short-term bullish trend, though nearing the upper boundary, posing potential resistance.
EUR/USD H1 Intraday Indicator Analysis:
While 9 out of 22 technical indicators show a Sell signal, 17 out of 18 moving averages indicate a Buy signal, with a mixed sentiment scoreboard (59% bulls vs. 41% bears).
Weekly Pivot Points:
- WR3 - 1.08296
- WR2 - 1.08114
- WR1 - 1.07992
- Weekly Pivot - 1.07932
- WS1 - 1.07810
- WS2 - 1.07750
- WS3 - 1.07568

Bullish and Bearish Scenarios:
EUR/USD Bullish Scenario:
- Continuation of the Trend: Respect of the ascending channel's support line signals ongoing bullish momentum.
- Breakout Above Resistance: A bullish breakout above the 100-period EMA and upper channel line could indicate a stronger upward move.
- RSI Confirmation: RSI moving higher without entering overbought territory would support a bullish outlook.
EUR/USD Bearish Scenario:
- Reversal Patterns Confirmation: Respect of 'Shooting Star' and 'Bearish Engulfing' patterns may lead to a downside reversal.
- Break Below Support: A bearish scenario unfolds if the price breaks below the ascending channel and the 50-period DEMA.
- RSI Decline: A downward move in RSI below the midpoint could signal increasing bearish momentum.
Useful Links
Important Notice
The begginers in forex trading need to be very careful when making decisions about entering the market. Before the release of important reports, it is best to stay out of the market to avoid being caught in sharp market fluctuations due to increased volatility. If you decide to trade during the news release, then always place stop orders to minimize losses.
Without placing stop orders, you can very quickly lose your entire deposit, especially if you do not use money management and trade large volumes. For successful trading, you need to have a clear trading plan and stay focues and disciplined. Spontaneous trading decision based on the current market situation is an inherently losing strategy for a scalper or daytrader.


