


Analyzing Wednesday's trades:
GBP/USD on 30M chart
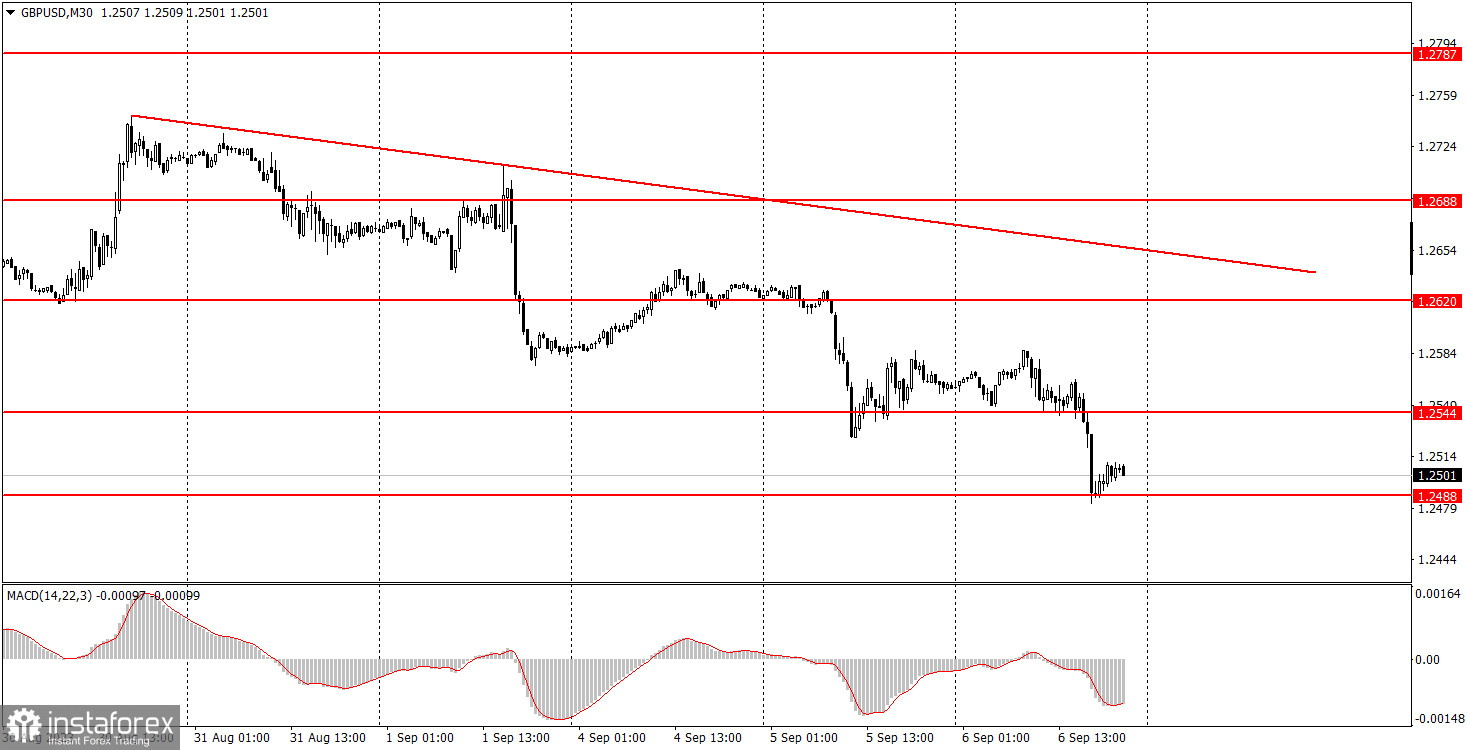
On Wednesday, GBP/USD showed quite a bit of volatility and also started a new bearish movement. In the first half of the day, the pair's movement seemed more like a flat, but then it started to fall in the afternoon due to the US ISM Services PMI. The descending trendline remains relevant, and the British pound is falling almost every day, which is in line with our expectations.
Apart from the PMIs in the United States, there were no other influential reports. The index turned out to be strong, which is why the dollar strengthened. However, take note that we already expected the US currency to appreciate even without any fundamental and macroeconomic support. Last week, the US released disappointing reports, and yet the greenback barely fell over the course of five working days.
GBP/USD on 5M chart
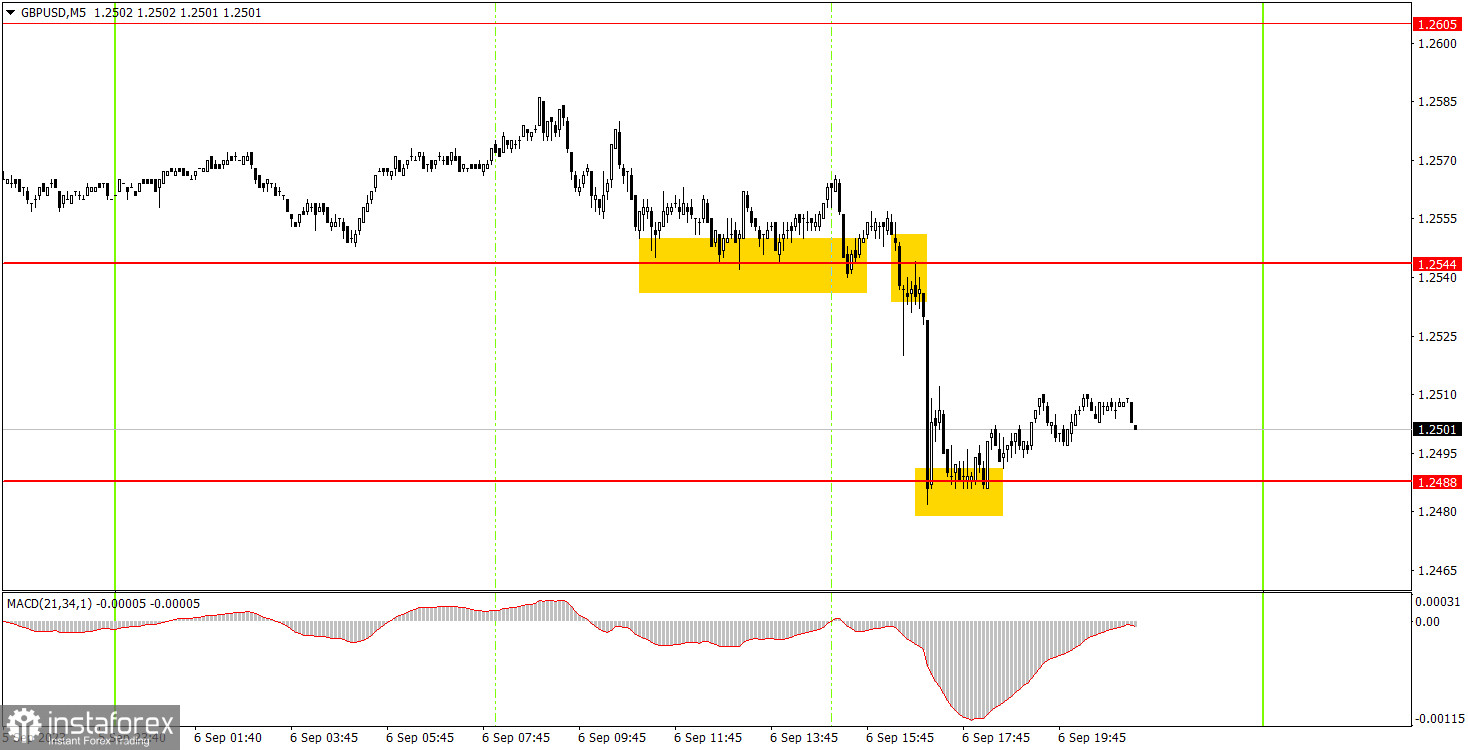
The movements on the 5-minute chart weren't great. During the European session, the price repeatedly bounced from the 1.2544 level. Beginners could have opened a long position based on these signals, but it should have been manually closed before the ISM Services PMI was published in the United States. Thus, traders did not incur any losses, even though it was a false signal. Later on, a sell signal formed as the price consolidated below the 1.2544 level, and it could have been executed. However, it was risky to enter a trade before the report was released, and we would not recommend doing so. Therefore, it was better to skip this signal. The last buy signal formed around the 1.2488 level, and it could have yielded 10-20 pips. Better than nothing.
Trading tips on Thursday:
On the 30-minute chart, the GBP/USD pair ended a round of bullish correction and finally resumed its downward movement. The movements are quite erratic, and even if the pair did fall on Wednesday, we can't be certain that it will continue to fall. Therefore, you should be cautious when you enter a position. The key levels on the 5M chart are 1.2372, 1.2457, 1.2488, 1.2544, 1.2605-1.2620, 1.2653, 1.2688, 1.2748, 1.2787-1.2791, 1.2848-1.2860. Once the price moves 20 pips in the right direction after opening a trade, you can set the stop-loss at breakeven. On Thursday, there are no important events or reports lined up in the UK, and the US only has a report on jobless claims, which probably won't move the market.
Basic trading rules:
1) The strength of the signal depends on the time period during which the signal was formed (a rebound or a break). The shorter this period, the stronger the signal.
2) If two or more trades were opened at some level following false signals, i.e. those signals that did not lead the price to Take Profit level or the nearest target levels, then any consequent signals near this level should be ignored.
3) During the flat trend, any currency pair may form a lot of false signals or do not produce any signals at all. In any case, the flat trend is not the best condition for trading.
4) Trades are opened in the time period between the beginning of the European session and until the middle of the American one when all deals should be closed manually.
5) We can pay attention to the MACD signals in the 30M time frame only if there is good volatility and a definite trend confirmed by a trend line or a trend channel.
6) If two key levels are too close to each other (about 5-15 pips), then this is a support or resistance area.
How to read charts:
Support and Resistance price levels can serve as targets when buying or selling. You can place Take Profit levels near them.
Red lines are channels or trend lines that display the current trend and show which direction is better to trade.
MACD indicator (14,22,3) is a histogram and a signal line showing when it is better to enter the market when they cross. This indicator is better to be used in combination with trend channels or trend lines.
Important speeches and reports that are always reflected in the economic calendars can greatly influence the movement of a currency pair. Therefore, during such events, it is recommended to trade as carefully as possible or exit the market in order to avoid a sharp price reversal against the previous movement.
Beginners should remember that every trade cannot be profitable. The development of a reliable strategy and money management are the key to success in trading over a long period of time.


