


The EUR/USD currency pair continued its downward movement calmly during the third trading day of the week. The decline could have been stronger this time, and the daily volatility was less than 50 points. However, what matters here is not the individual movement but the overall trend. The overall trend tells us that the European currency has been declining steadily and confidently for a month and a half now. In the 24-hour time frame, the pair crossed the Ichimoku cloud, significantly increasing the likelihood of further declines. We have long been anticipating a strong southern movement, and perhaps it has finally begun.
Yesterday, there needed to be more macroeconomic data in the European Union and the United States. The retail sales report was released in the EU, which turned out to be slightly worse than expected. At the same time, in the US, the ISM Business Activity Index for the services sector exceeded forecasted values. Thus, two out of two reports favored the American currency. As previously mentioned, we did not see a significant rise in the dollar, but it had strengthened quite well a few days earlier. Yesterday, there was no upward correction either. Last week, when there were indeed reasons for a strong dollar decline, it did not happen. Therefore, combining these factors indicates a bearish sentiment in the market. Consequently, the decline can and should continue.
Meanwhile, the European currency continues to lose support. Earlier, the market expected the ECB to raise interest rates more strongly in 2023 than the Fed. Simply because the ECB began tightening later and at a slower pace. However, it became clear this summer that the European regulator would have to catch up with the Fed. We even mentioned earlier this year that the ECB would not raise rates as strongly as the American regulator. As a result, traders now realize that the ECB may conclude its tightening policy soon and will take years to bring inflation back to 2%.
ECB members are softening their rhetoric.
This week saw several speeches by members of the ECB's monetary committee and two by Christine Lagarde. The head of the ECB blatantly ignored all questions about interest rates at the September meeting, which made the market nervous and the euro fall. Peter Kazimir and Villeroy de Galhau added fuel to the fire. Both stated that no further tightening should be expected from the ECB and that, at most, one more rate hike could occur. It could happen in September, October, or December – the timing doesn't matter. Kazimir even openly stated that there would be no more than one rate hike and that we would have to wait until 2025 to see inflation return to 2%. Thus, monetary rhetoric continues to soften and become more "dovish." Recall that two months ago, the first signs appeared that the ECB was planning to pause in September.
Naturally, such a change in the regulator's sentiment does not bode well for the euro. If the European currency was rising in anticipation of a rate hike, then based on what should it rise now? The US economy still looks stronger, the euro is overbought, and US monetary policy is more substantial than the ECB's. All factors point to the European currency falling and the dollar rising.
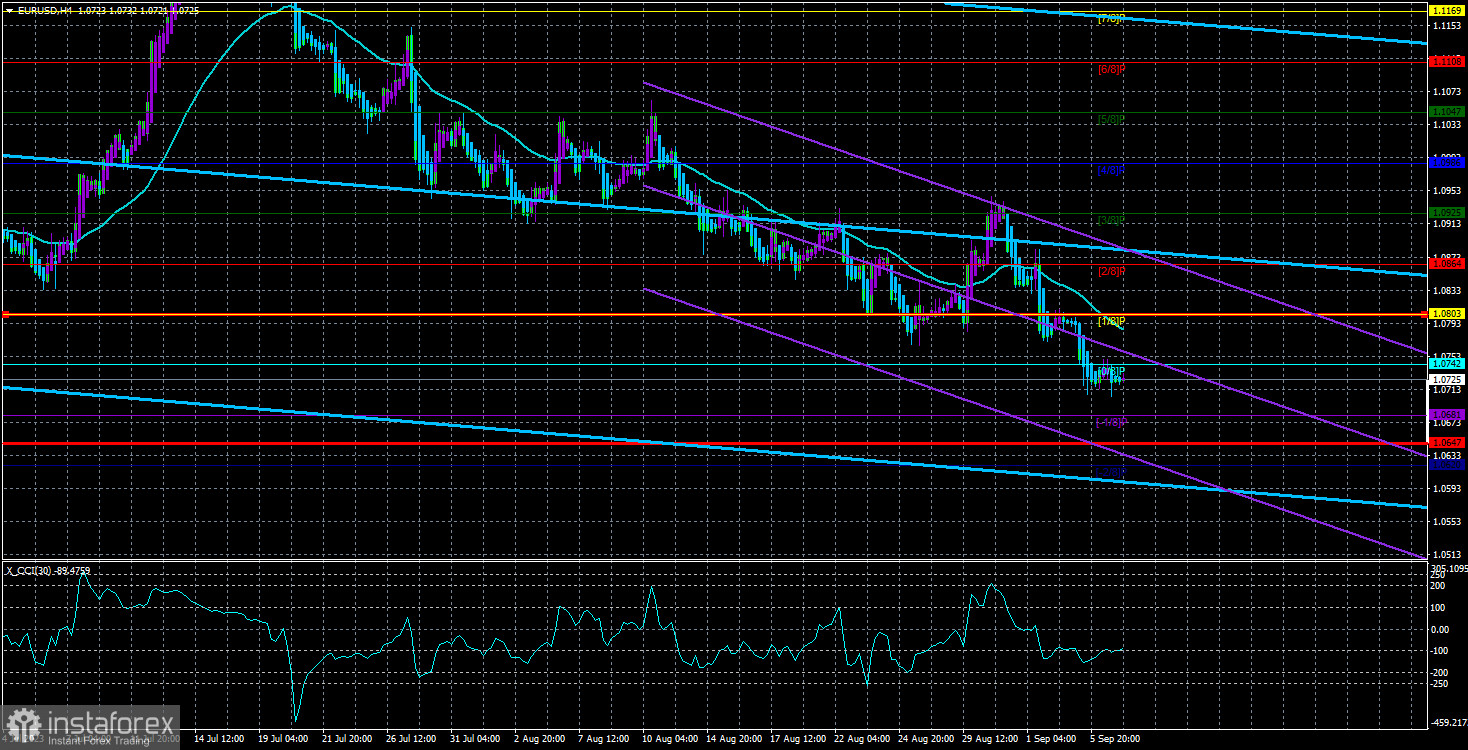
Certainly, it's always essential to have a "Plan B" to avoid getting caught off guard. Therefore, even when it seems all factors point in one direction, one should remember that there is never 100% certainty in the market. Consequently, one should remember the technical picture and technical signals. At the moment, everything is in order. On the 4-hour timeframe, the pair is below the moving average, both linear regression channels are pointing downward, and on the daily chart, the price is below all Ichimoku indicator lines. Therefore, trading for a decrease can be done calmly until the price consolidates above the moving average.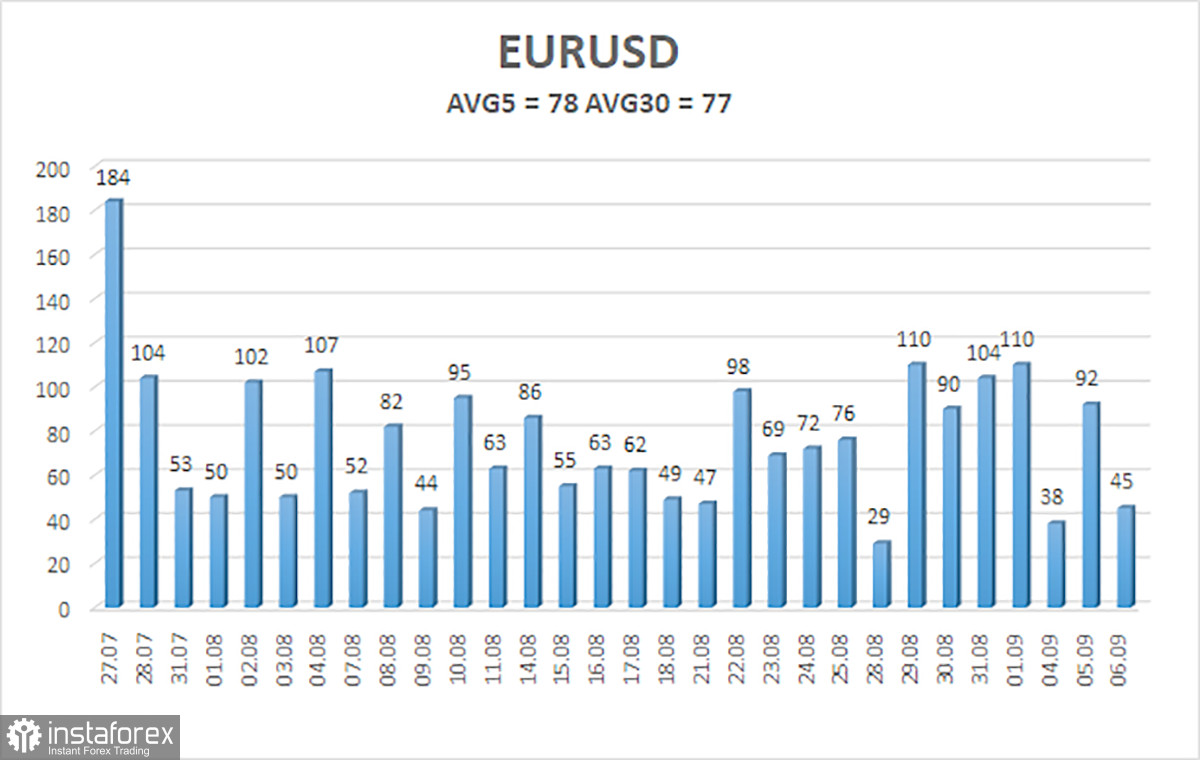
The average volatility of the EUR/USD currency pair for the last five trading days as of September 7th is 78 points and is characterized as "average." Thus, we expect the pair to move between the levels of 1.0647 and 1.0803 on Thursday. An upward reversal of the Heiken Ashi indicator will indicate a new phase of an ascending correction.
The nearest support levels:
S1 – 1.0681
S2 – 1.0620
The nearest resistance levels:
R1 – 1.0742
R2 – 1.0803
R3 – 1.0864
Trading recommendations:
The EUR/USD pair continues its southward movement. Staying in short positions with targets at 1.0681 and 1.0647 is advisable until the Heiken Ashi indicator reverses upward. Long positions can be considered if the price consolidates above the moving average line with targets at 1.0864 and 1.0925.
Explanations for the illustrations:
Linear regression channels - help determine the current trend. If both channels point in the same direction, the trend is currently strong.
Moving Average Line (settings 20.0, smoothed) - determines the short-term trend and the direction in which trading should be conducted.
Murray Levels - target levels for movements and corrections.
Volatility levels (red lines) - the probable price range the pair will trade in the next 24 hours based on current volatility indicators.
CCI Indicator - its entry into the overbought territory (above +250) or the oversold territory (below -250) indicates an approaching trend reversal in the opposite direction.


