


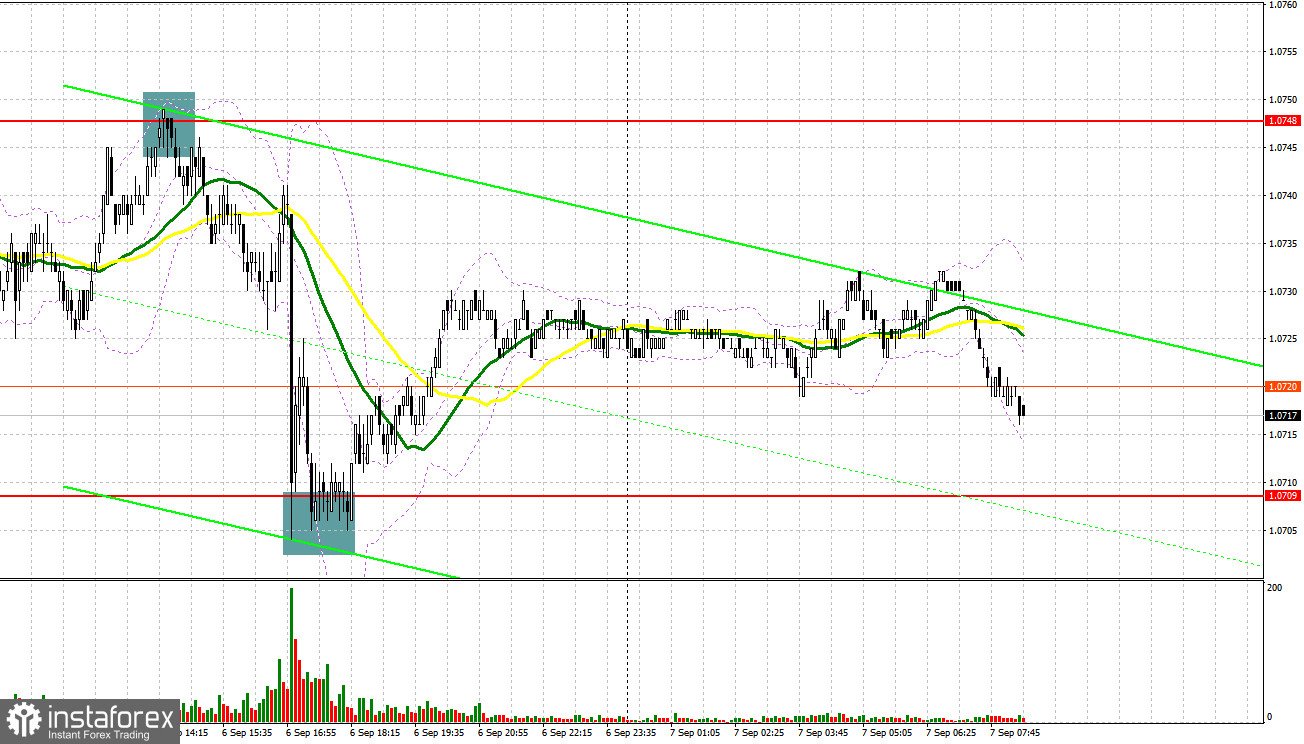
Yesterday, the pair formed several excellent entry signals. Let's see what happened on the 5-minute chart. In my morning review I mentioned the level of 1.0748 as a possible entry point. The price rose to this level and made a false breakout but I decided not to sell the pair as I could not place a stop-loss order. The risk/reward ratio was not so good. In the afternoon, another entry point into short positions was formed at 1.0748 which resulted in a decline of more than 40 pips. Buying activity at 1.0709 and its false breakout generated a buy signal and moved the price up by 25 pips.
For long positions on EUR/USD:
Strong data on the US services sector has weighed on the euro, leading to another test of the monthly low. However, buyers managed to hold at 1.0700 level, keeping a glimmer of hope for a rebound by week's end. Today's data release includes Germany's industrial production figures, which are not expected to be promising, as well as the Eurozone's Q2 GDP growth and employment level changes. If these figures are revised downwards, which is likely, it will further pressure the euro. Given the bearish market trend, I will act on a decline after a false breakout around yesterday's support at 1.0709. Divergence on the MACD indicator during the test of this range will confirm the entry point for long positions, targeting a recovery towards 1.0748, a resistance from yesterday. Just below this level, the moving averages favor the bears. A breakout and a downward test of this range, bolstered by good data from the Eurozone and Germany, will increase demand for the euro, providing a chance for a surge to 1.0772. The furthest target would be the 1.0798 area, where I plan to take profits If EUR/USD declines and there is no activity at 1.0709, bears will retain market control. In such a case, only a false breakout around 1.0669 will signal a buying opportunity. I will open long positions directly on a rebound from 1.0637, aiming for an upward correction of 30-35 pips within the day.
For short positions on EUR/USD:
Sellers continue to dominate the market. All they need to focus on in the first half of the day is defending the level of 1.0748. Another round of weak Eurozone data will enable bears to defend 1.0748, where a false breakout will give a sell signal, paving the way towards the 1.0707 support level. Only after breaching this range and settling below it, and after completing an upward retest, do I anticipate another sell signal with a target at 1.0669, where I expect significant buyer activity. The furthest target is the 1.0637 area, where I plan to take profit. If EUR/USD moves upwards during the European session and bears are absent at 1.0748, bulls will have a chance to build an upward correction against the bearish trend. In such a scenario, I would delay short positions until the price hits the new resistance at 1.0772. I would also consider selling there but only after an unsuccessful consolidation. I will open short positions directly on a rebound from the high of 1.0798, considering a downward correction of 30-35 pips.
COT report
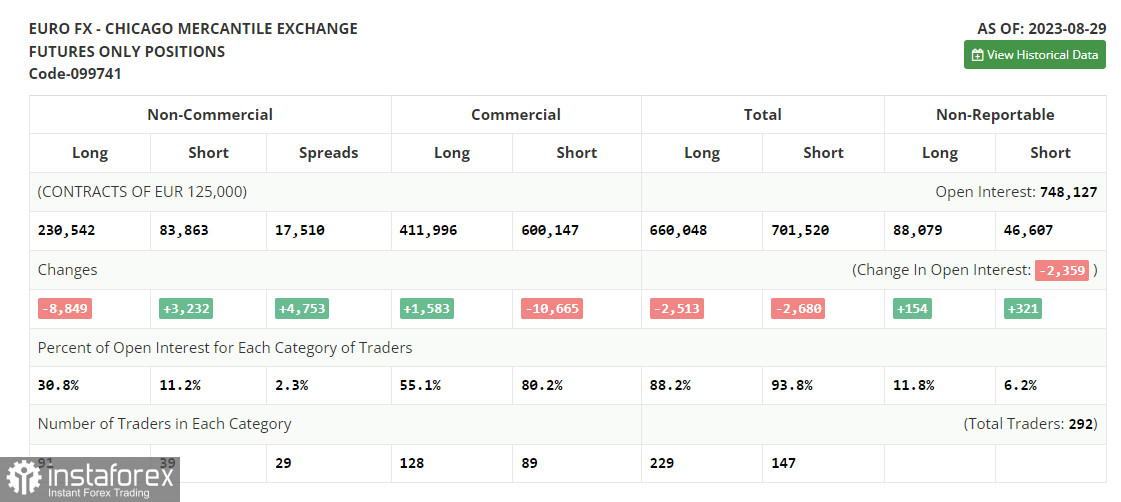
The Commitments of Traders (COT) report for August 29 indicates a reduction in long positions and an increase in short ones. Such market shifts mirror the hawkish remarks made by the Federal Reserve Chairman Jerome Powell at the Jackson Hole Symposium. The recently released data on the US Personal Consumption Expenditures Index and the labor market have further convinced investors that the Fed might need to hike rates once more, thus preserving the dollar's allure. Interestingly, the euro's decline offers a compelling point of entry. In the present circumstances, an optimal medium-term strategy remains to buy risk assets on dips. The COT report reveals that the non-commercial long positions decreased by 8,849 to stand at 230,542, while the non-commercial short positions jumped by 3,232 to 83,863. Consequently, the spread between long and short positions expanded by 4,753. The closing price dropped to 1.0882 from 1.0866, indicating a bearish market.
Indicator signals:
Moving Averages
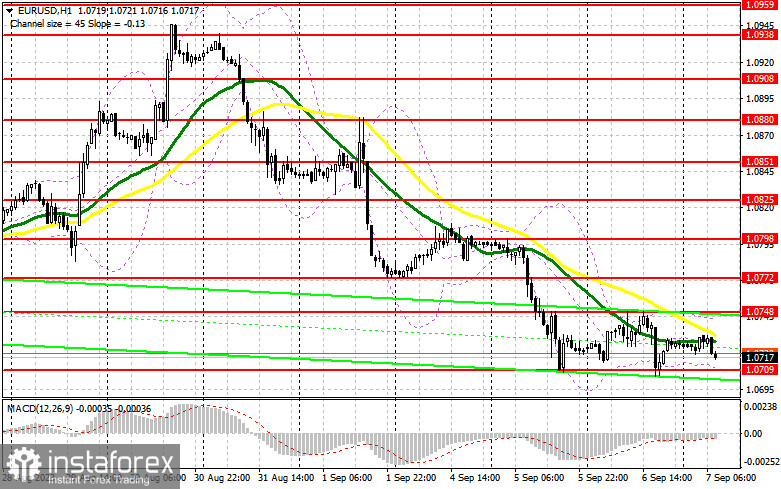
Trading below the 30- and 50-day moving averages indicates resumed pressure on the pair.
Please note that the time period and levels of the moving averages are analyzed only for the H1 chart, which differs from the general definition of the classic daily moving averages on the D1 chart.
Bollinger Bands
If the pair declines, the lower band of the indicator at 1.0709 will act as support.
Description of indicators:
• A moving average of a 50-day period determines the current trend by smoothing volatility and noise; marked in yellow on the chart;
• A moving average of a 30-day period determines the current trend by smoothing volatility and noise; marked in green on the chart;
• MACD Indicator (Moving Average Convergence/Divergence) Fast EMA with a 12-day period; Slow EMA with a 26-day period. SMA with a 9-day period;
• Bollinger Bands: 20-day period;
• Non-commercial traders are speculators such as individual traders, hedge funds, and large institutions who use the futures market for speculative purposes and meet certain requirements;
• Long non-commercial positions represent the total number of long positions opened by non-commercial traders;
• Short non-commercial positions represent the total number of short positions opened by non-commercial traders;
• The non-commercial net position is the difference between short and long positions of non-commercial traders.


