The Cabinet of Ministers of Japan will release data (final estimate) on the Japanese GDP at 23:50 GMT. According to the forecast, Japan's GDP is expected to grow by 1.3% and by 5.5% annually (the preliminary estimate was 1.5% (6.0% annually) with a forecast of 0.8% (3.1% annually)). Overall, despite the relative decline, this is a positive factor for both the yen and the Japanese stock market.
The yen will likely strengthen after the publication of this GDP report. However, expecting its long-term or even medium-term growth is not yet warranted. One of the main reasons here remains the ultra-loose monetary policy of the Bank of Japan.

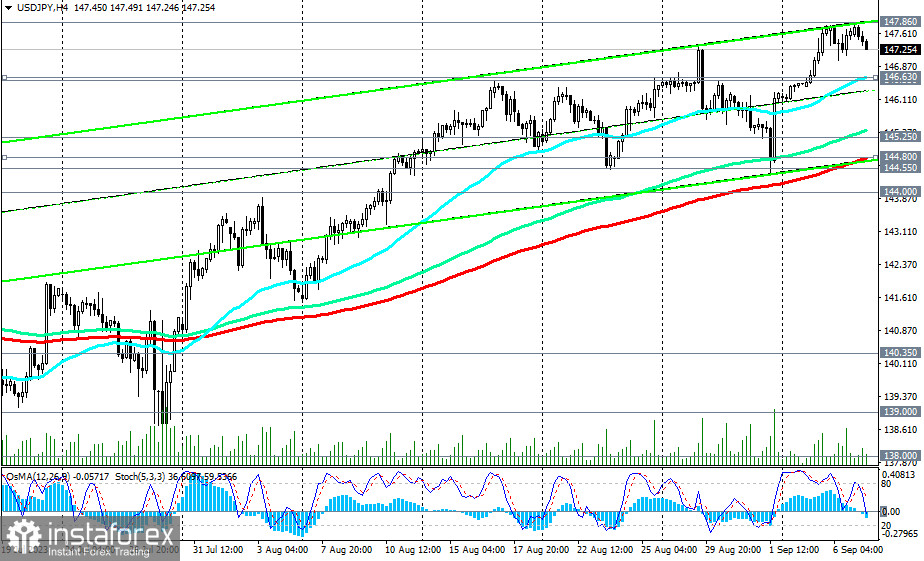
The yen's weakness is reflected in its dynamics in the currency market. Thus, the USD/JPY pair reached a high during today's Asian trading session, touching 147.86, the highest level since November 2022.
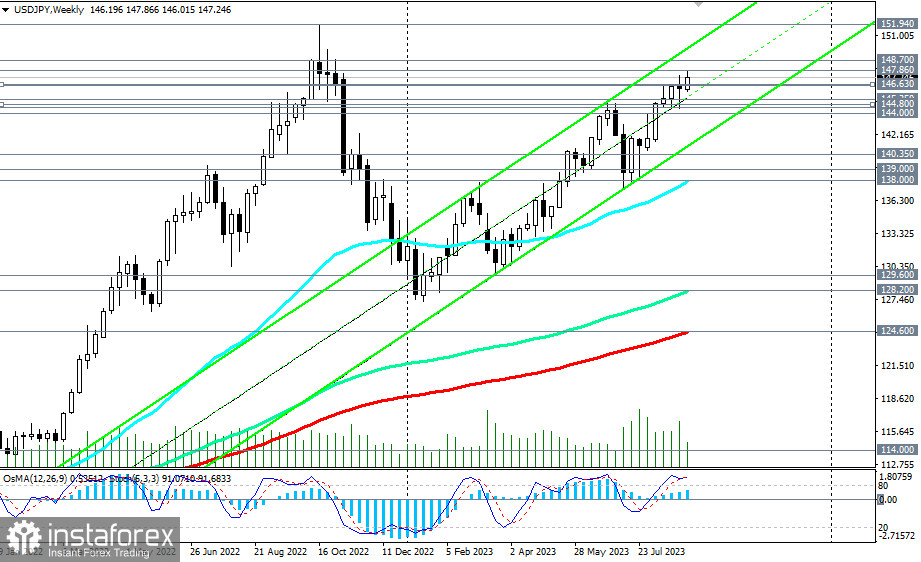
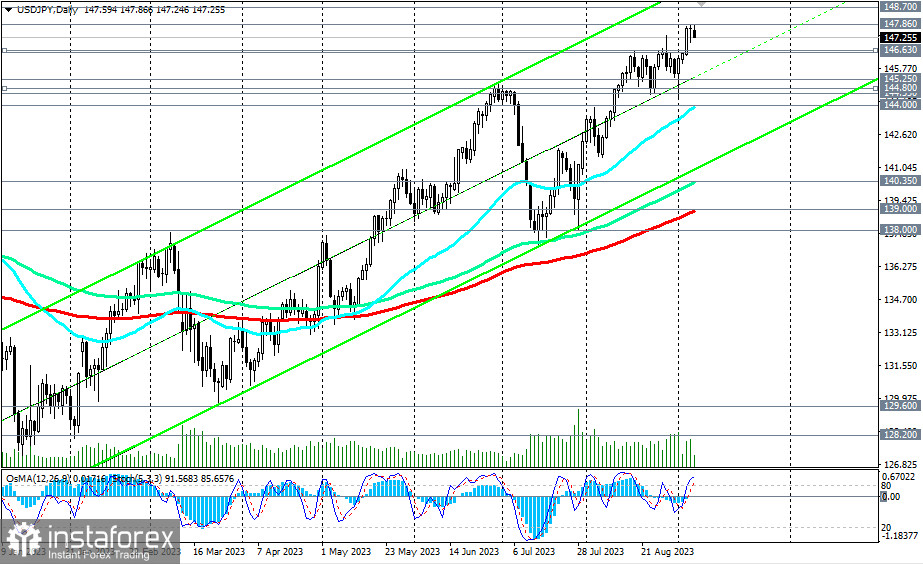
Furthermore, since April 2023, USD/JPY has continued to rise in a stable upward trend, trading in the bull market zone, above the support level of 112.30 (200 EMA on the monthly chart), the long-term support level of 124.60 (200 EMA on the weekly chart), and the medium-term support level of 139.00 (200 EMA on the daily chart).

Therefore, a breakout above the 147.86 level may signal an increase in long positions.
Purchases are also possible on pullbacks to the support levels of 146.63 (200 EMA on the 1-hour chart), 146.55 with stops below 146.20, and to the support levels of 144.80 (200 EMA on the 4-hour chart), 144.55 with stops below 144.40.
A breakout of the medium-term support level of 144.00 (50 EMA on the daily chart) may trigger a deeper correction down to the support levels of 140.35 (144 EMA on the daily chart), 139.00 (200 EMA on the daily chart). Passing through the support level of 138.00 (50 EMA on the weekly chart) may even break the medium-term bullish trend of USD/JPY.
Nevertheless, long positions remain preferable for now.
Support levels: 147.00, 146.63, 146.55, 146.27, 146.00, 145.25, 145.00, 144.80, 144.55, 140.35, 140.00, 139.00, 138.00
Resistance levels: 147.86, 148.00, 148.70, 149.00


