Analysis of Thursday trades:
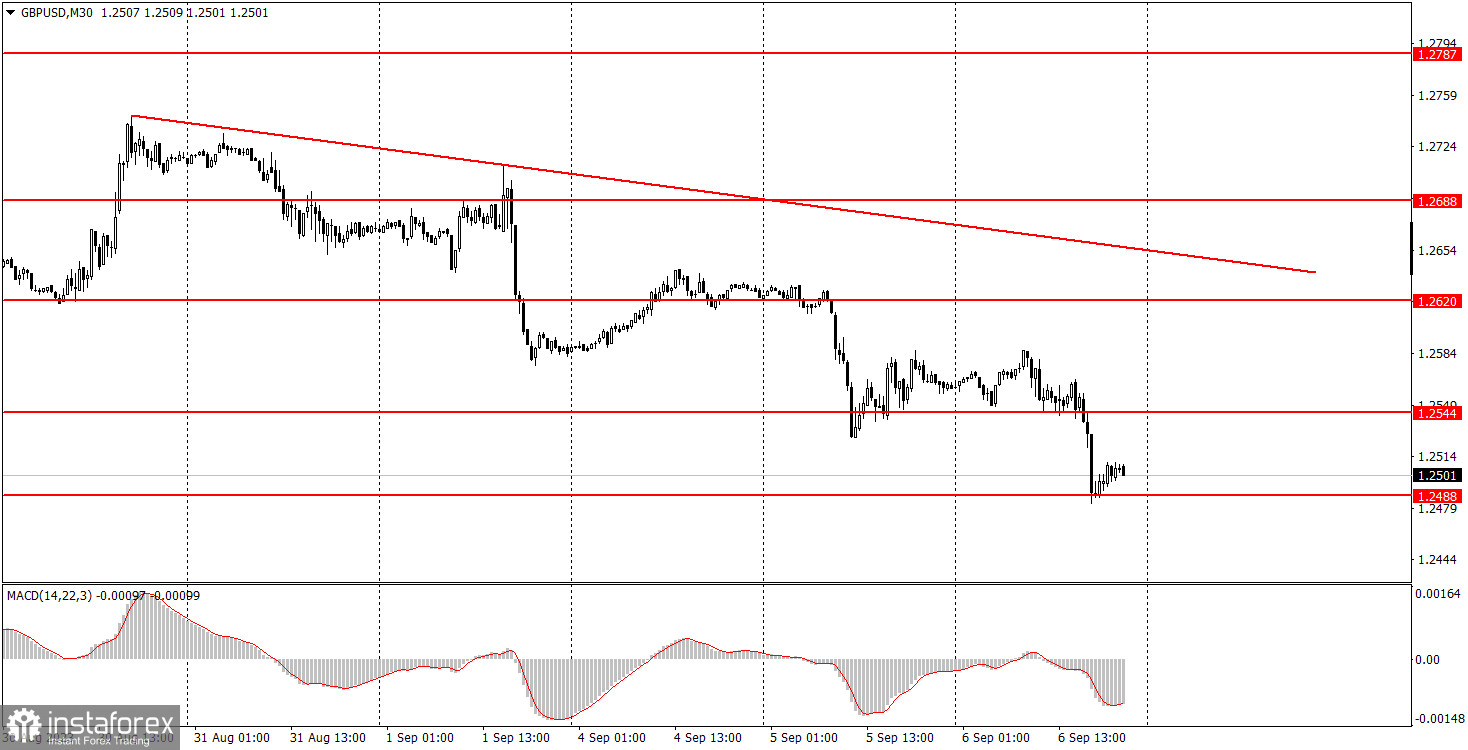
GBP/USD 30M chart

By Thursday's end, the GBP/USD pair continued its decline. Volatility was nearly flat, with even fewer reports and events that could influence the pair's movement throughout the day compared to the euro. Traders could essentially only focus on the U.S. jobless claims report. The figure came in above forecasts, though not enough to spur a 50-60 pip rise in the dollar. Additionally, there was a speech by the Fed's Patrick Harker today, but the intraday movement suggests that no significant information was conveyed.
Consequently, the downward trend persists. The pound drops almost daily, aligning perfectly with our anticipations and forecasts. We believe that the Bank of England will likely adopt a more dovish stance soon, providing no strong foundation for a sharp appreciation in the British currency. A modest correction remains the most plausible scenario.
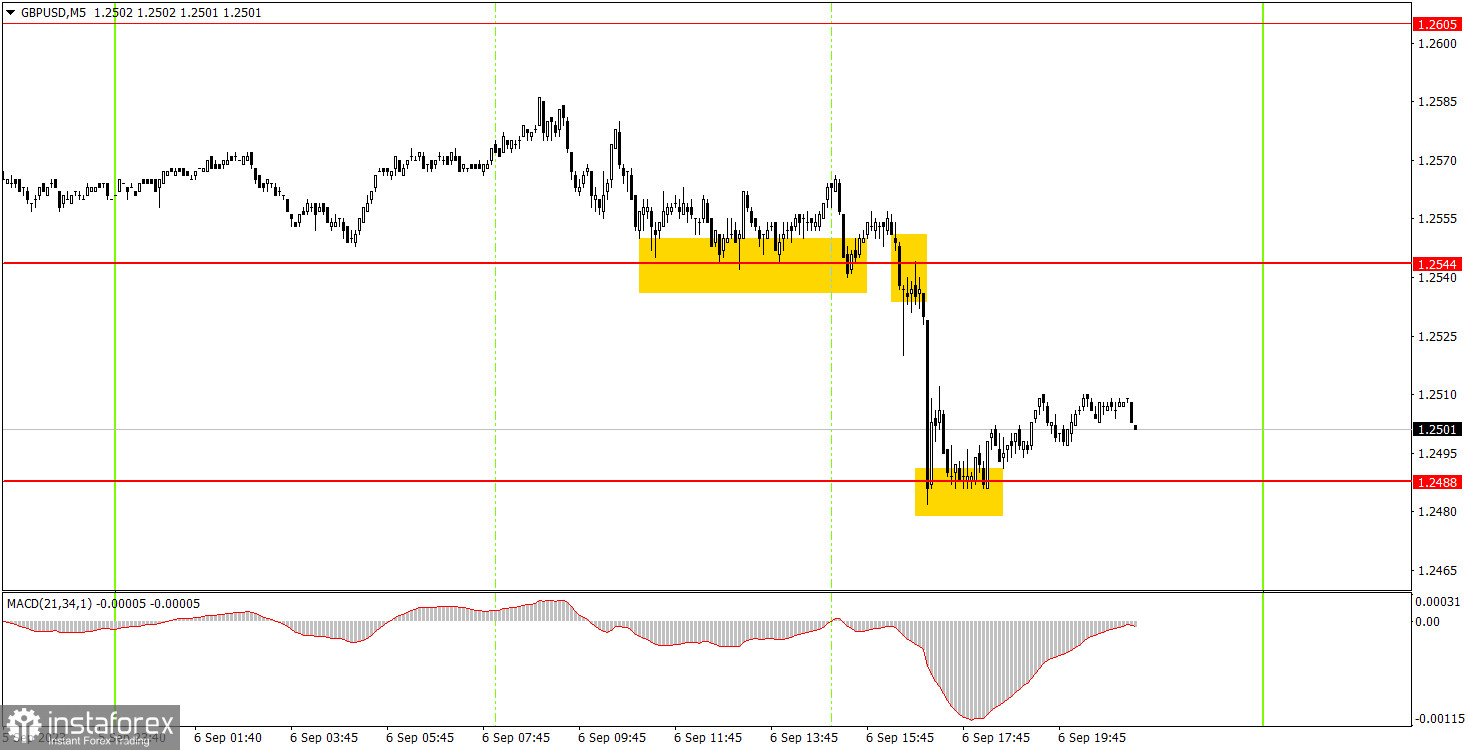
GBP/USD 5M chart

On Thursday, the 5-minute timeframe saw movements oscillating between 1.2457 and 1.2488 throughout the day. Naturally, it wasn't prudent to trade between these levels – their proximity rendered them unsuitable for meaningful trading. The pair attempted to secure below the 1.2457 level several times, but even then, going short would have been risky, as the Stop Loss would have been positioned above the 1.2488 level. Given the lack of expected volatility, potential loss dimensions outweighed possible gains.
Trading insights for Friday:
On the 30-minute timeframe, GBP/USD continues its descent almost daily. While movements are currently quite erratic, the downward trend remains notably consistent. For now, there are no visible indicators of this short-term bearish trend concluding. The key levels on a 5-minute chart are the following: 1.2307, 1.2372, 1.2457, 1.2488, 1.2544, 1.2605-1.2620, 1.2653, 1.2688, 1.2748, and 1.2787-1.2791. After a trade opens and moves 20 pips in the anticipated direction, it's advisable to set the Stop Loss to break-even. No significant reports or events are scheduled for Friday in either the UK or the US. Volatility is likely to remain subdued, making trading this pair particularly challenging.
Basic rules of a trading system:
1) Signal strength is determined by the time taken for its formation (either a bounce or level breach). A shorter formation time indicates a stronger signal.
2) If two or more trades around a certain level are initiated based on false signals, subsequent signals from that level should be disregarded.
3) In a flat market, any currency pair can produce multiple false signals or none at all. In any case, the flat trend is not the best condition for trading.
4) Trading activities are confined between the onset of the European session and mid-way through the U.S. session, post which all open trades should be manually closed.
5) On the 30-minute timeframe, trades based on MACD signals are only advisable amidst substantial volatility and an established trend, confirmed either by a trend line or trend channel.
6) If two levels lie closely together (ranging from 5 to 15 pips apart), they should be considered as a support or resistance zone.
How to read charts:
Support and Resistance price levels can serve as targets when buying or selling. You can place Take Profit levels near them.
Red lines represent channels or trend lines, depicting the current market trend and indicating the preferable trading direction.
The MACD(14,22,3) indicator, encompassing both the histogram and signal line, acts as an auxiliary tool and can also be used as a signal source.
Significant speeches and reports (always noted in the news calendar) can profoundly influence the price dynamics. Hence, trading during their release calls for heightened caution. It may be reasonable to exit the market to prevent abrupt price reversals against the prevailing trend.


