


Trend analysis (Fig. 1).
The EUR/USD currency pair may move upward from the level of 1.0699 (closing Friday's daily candle) with a target of 1.0748, the 8-period EMA (blue thin line). In the case of testing this level, a continued upward movement is possible to 1.0772, the 14.6% pullback level (blue dotted line).
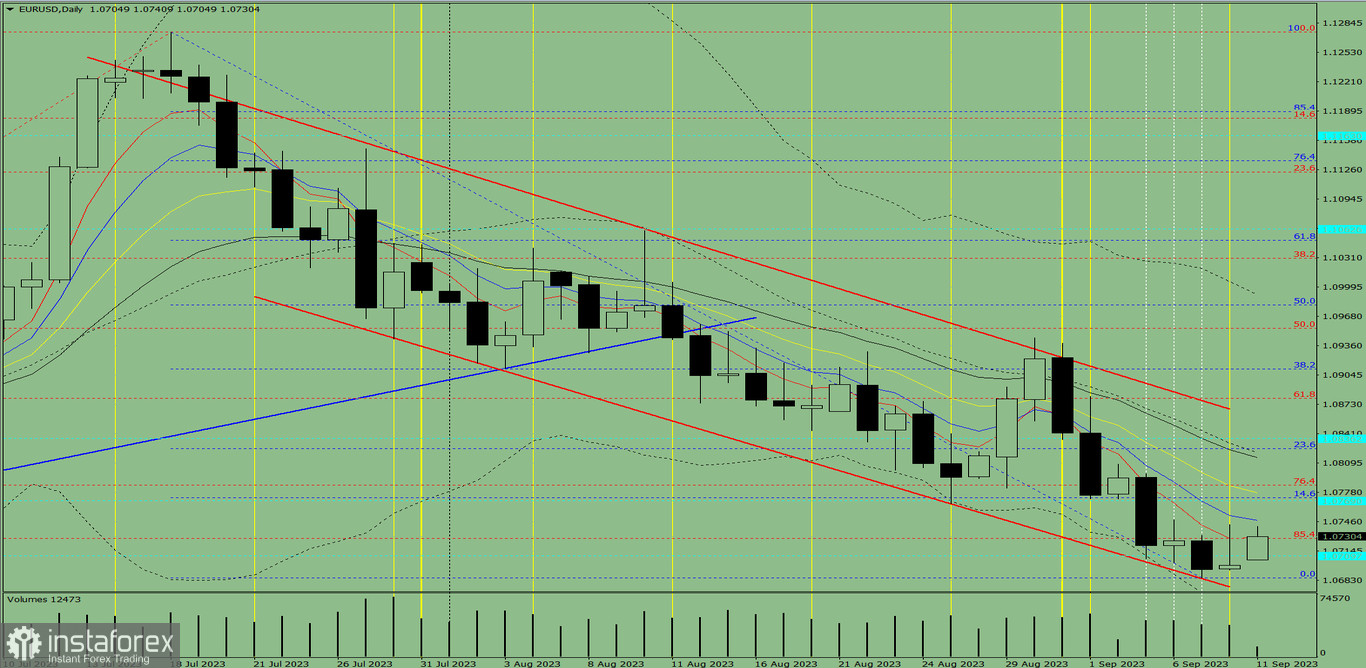
Fig. 1 (daily chart).
Comprehensive analysis:
- Indicator analysis – up;
- Fibonacci levels – up;
- Volumes – up;
- Candlestick analysis – down;
- Trend analysis – up;
- Bollinger bands – down;
- Weekly chart – up.
General conclusion: Today, the price may move upward from the level of 1.0699 (closing Friday's daily candle) with a target of 1.0748, the 8-period EMA (blue thin line). In the case of testing this level, a continued upward movement is possible to 1.0772, the 14.6% pullback level (blue dotted line).
Alternatively, the price may move upward from the level of 1.0699 (closing Friday's daily candle) with a target of 1.0748, the 8-period EMA (blue thin line). In the case of testing this level, the price may move down.


