EUR/USD Technical Insight for February 20, 2024
Unlocking Currency Pair Trends: A Strategic Overview
Key Takeaways:
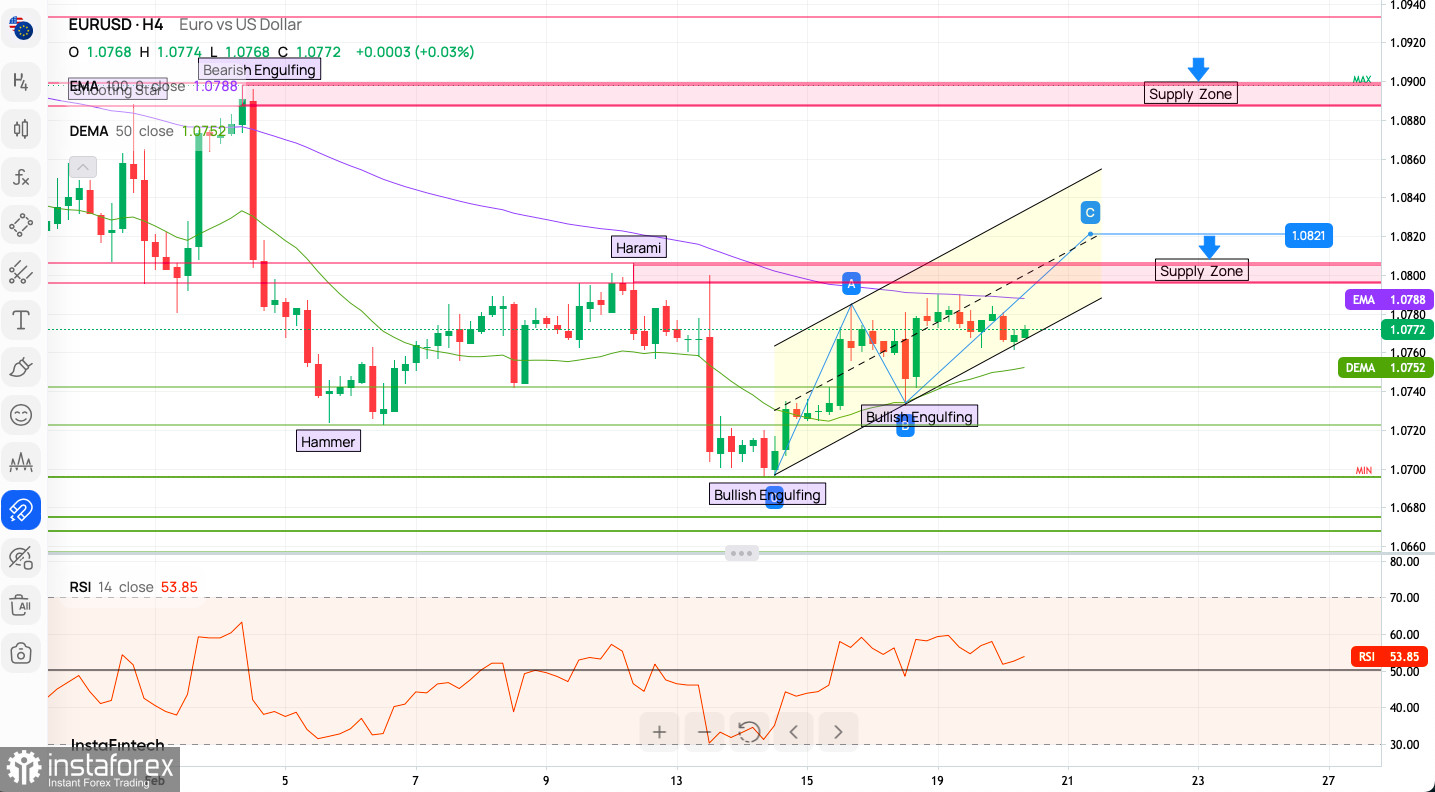
- The EUR/USD faces resistance at the 100 MA, with a recent rejection indicating a bearish test.
- Technical indicators present a mixed sentiment, with a lean towards consolidation.
- The pivot point analysis underscores a pivotal moment for traders, highlighting key levels for potential action.

In the realm of forex trading, the EUR/USD pair offers an intriguing snapshot of market sentiment and potential directional moves. As of February 20, 2024, the currency duo has navigated through a complex web of economic indicators, market sentiment, and technical patterns, all of which play a crucial role in shaping the trading landscape.
Morning Brief: A Glimpse into Global Markets
The global financial scene provides a backdrop to the EUR/USD pair's movements, with varying degrees of volatility observed across different markets. Notably, Asian markets showed restrained activity, with minor fluctuations in major indices. This calm was mirrored in the forex market, where the Japanese yen and the US dollar showcased modest movements within a narrow range.
Monetary policy decisions from major central banks, including the People's Bank of China and the Reserve Bank of Australia, have introduced new dynamics into the market, influencing trader sentiment and currency valuations. Furthermore, the cryptocurrency market continues to consolidate, indicating a broader theme of market caution and search for direction.
Technical Market Outlook: Navigating EUR/USD Trends
The EUR/USD's technical landscape reveals a battle between bullish aspirations and bearish realities. Despite a push towards recovery, the pair encountered resistance near the 100 MA, hinting at underlying selling pressure. The detailed pivot point analysis further delineates the critical levels to watch, offering insights into potential bullish or bearish scenarios.

Weekly Pivot Points List and Analysis:
WR3 - 1.08116
WR2 - 1.07970
WR1 - 1.07902
Weekly Pivot - 1.07824
WS1 - 1.07756
WS2 - 1.07678
WS3 - 1.07568
Above the Weekly Pivot (1.07824)
WR1 (1.07902): This level is already within the upward channel and may act as immediate resistance. If the price sustains above WR1, it indicates bullish sentiment in the short term.
WR2 (1.07970): Breaching this level could lead to a test of the first supply zone around 1.0821, reinforcing the bullish scenario.
WR3 (1.08116): Crossing above WR3 would place the price action in a strong position to challenge the upper supply zone.
Below the Weekly Pivot (1.07824)
WS1 (1.07756): If the price dips below the weekly pivot and approaches WS1, it might find initial support. A break below this could indicate increasing bearish pressure.
WS2 (1.07678): This level is just above the DEMA 50, combining a pivot support with a dynamic support level. A breach below could signal a more significant shift in market sentiment.
WS3 (1.07568): Falling below WS3 would suggest a bearish outlook and could lead to further declines, potentially exiting the upward channel.
Analyzing Indicator Signals and Market Sentiment
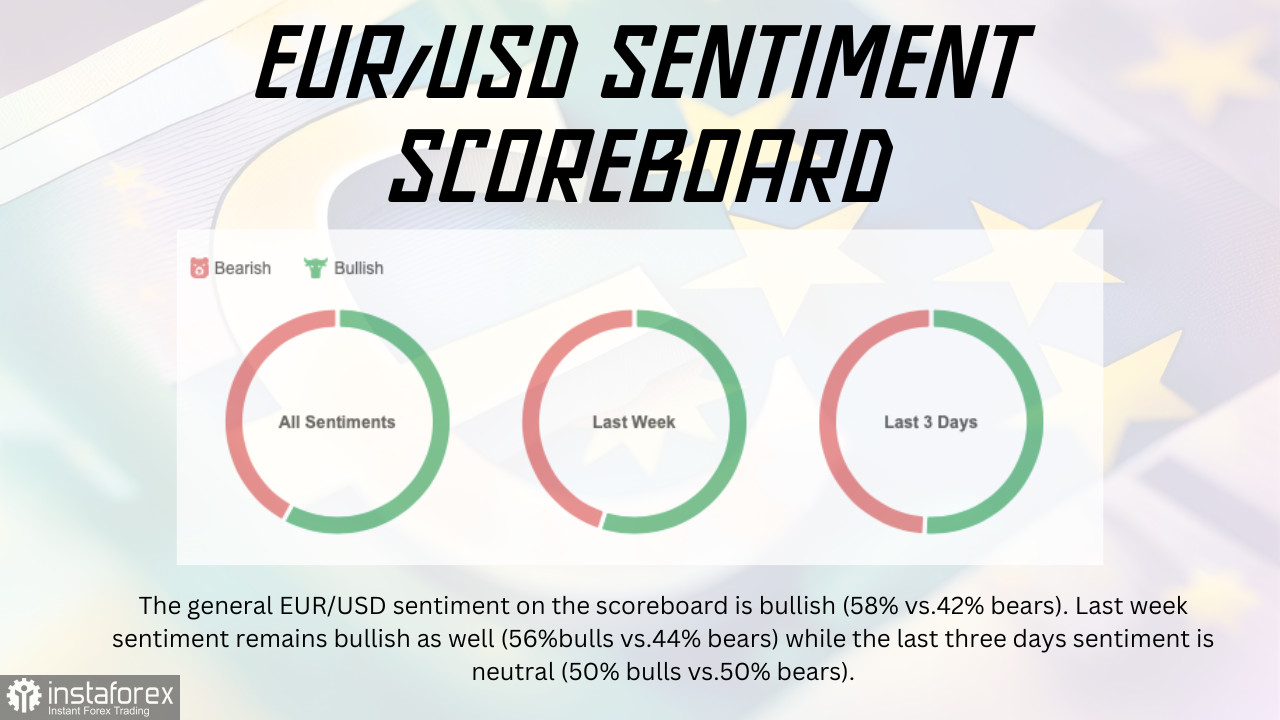
The intricate dance of technical indicators, from moving averages to the Relative Strength Index (RSI), provides a nuanced view of market dynamics. The sentiment scoreboard reflects a cautiously optimistic outlook among traders, yet the balanced sentiment over the last few days underscores the market's search for a clear direction.

Candlestick Patterns and Price Action
The presence of various candlestick patterns along the price chart serves as a testament to the ongoing tug of war between buyers and sellers. These patterns, ranging from hammers to engulfing formations, offer valuable clues about potential market reversals or continuations.
Towards a Decision: Trading Insights for the Intraday Traders
For those bullish on EUR/USD, the key lies in sustaining momentum above critical support levels and breaching resistance zones, potentially unlocking further upside. Conversely, bearish traders should watch for signs of rejection at resistance points or a break below support levels, which could signal a deeper pullback.
In conclusion, the EUR/USD pair stands at a crossroads, with technical analysis shedding light on the nuanced interplay of factors influencing its path. Traders, armed with these insights, are better positioned to navigate the uncertainties of the forex market, tailoring their strategies to the evolving landscape.
Useful Links
Important Notice
The begginers in forex trading need to be very careful when making decisions about entering the market. Before the release of important reports, it is best to stay out of the market to avoid being caught in sharp market fluctuations due to increased volatility. If you decide to trade during the news release, then always place stop orders to minimize losses.
Without placing stop orders, you can very quickly lose your entire deposit, especially if you do not use money management and trade large volumes. For successful trading, you need to have a clear trading plan and stay focues and disciplined. Spontaneous trading decision based on the current market situation is an inherently losing strategy for a scalper or daytrader.


