


Analysis of GBP/USD 5M
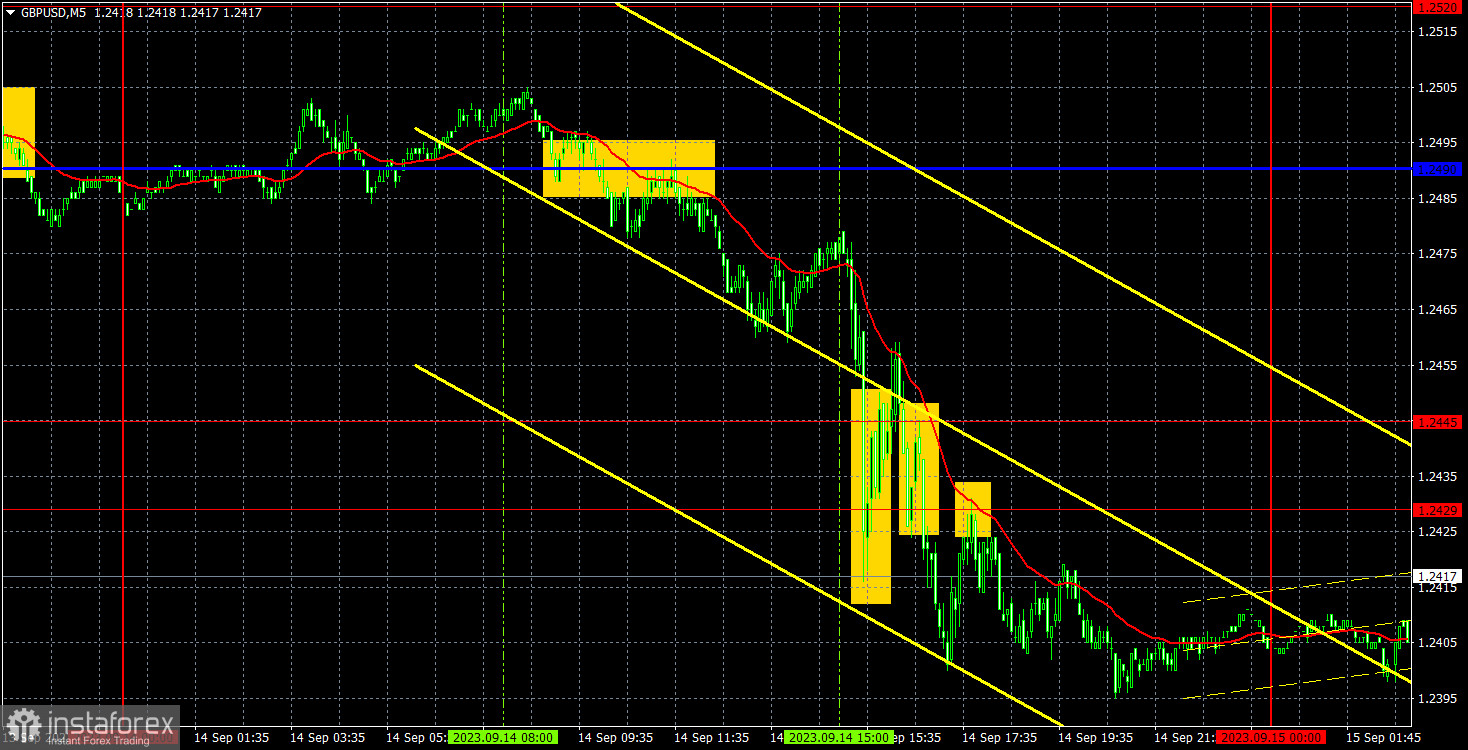
On the fourth trading day of the week, GBP/USD lost ground following the euro. There were no reasons or grounds for the British pound to drop. However, when the European currency fell, the pound followed suit. We've repeatedly pointed out to traders that the euro and pound sterling commonly drag each other along. That's precisely what happened yesterday. Nevertheless, we see nothing extraordinary in the pound's decline. Throughout the week, GBP/USD desperately tried to correct, but instead, we observed a mere flat movement. This indicates that the bulls are extremely weak and are not poised to buy. If they don't want to buy, it means the bears will set the tone in the market. All that was needed was a trigger for a new wave of sell-offs. Yesterday, the ECB meeting became that trigger.
Trading signals for the pound sterling were also not the best, but still better than for the euro. During the European trading session, GBP/USD rebounded from the critical line, so it was advisable to open short positions. At the time of the ECB announcement on interest rates, traders could set a Stop Loss at breakeven, as the profit level at that moment was not high. Later on, GBP/USD sank much lower. The market was overwhelmed by high volatility. The instrument was gyrating around the 1.2429-1.2445 area. We believe that it wasn't appropriate to act on signals in this area anymore, as a decent profit was already made on the first trade.
COT report
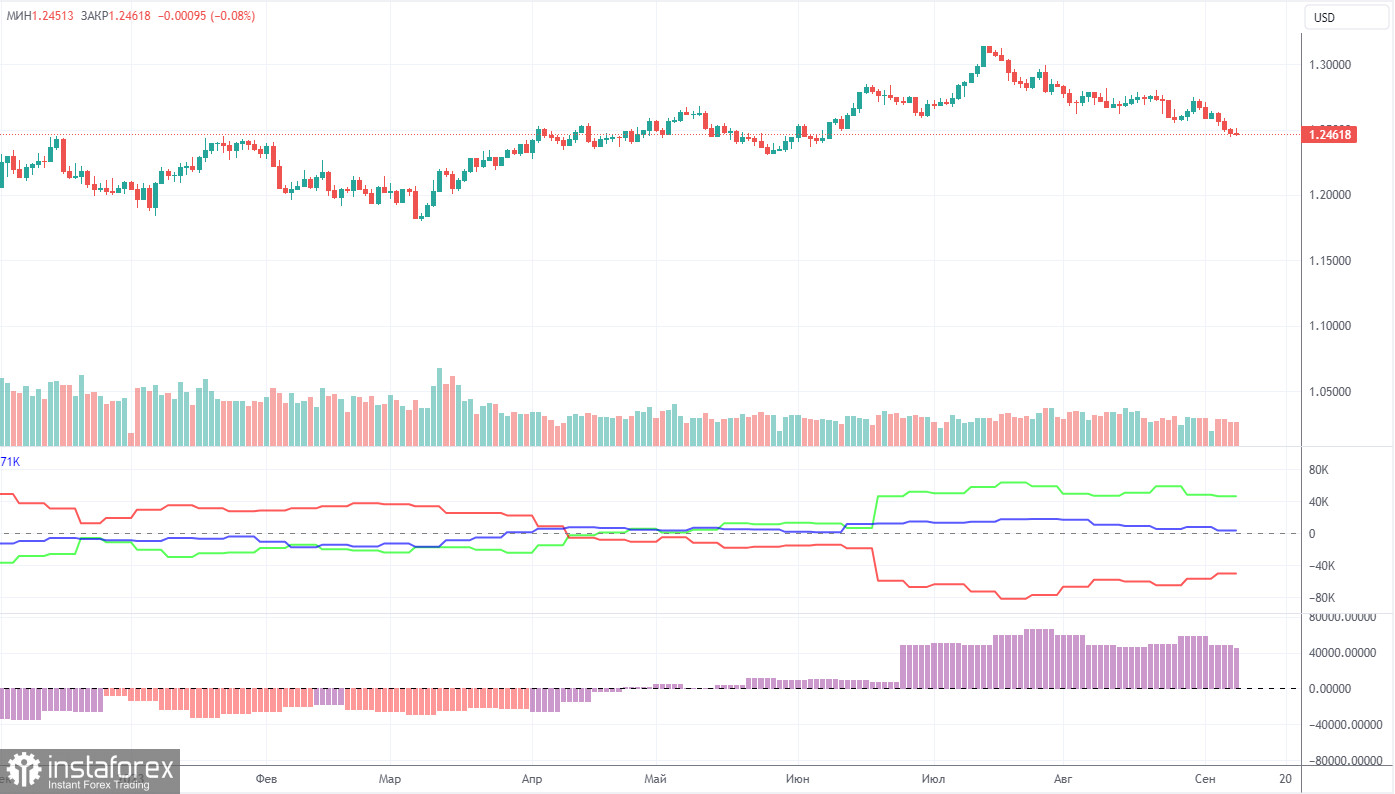
According to the latest COT report on GBP/USD, the Non-commercial group closed 0.9K buy contracts and opened 9.8K sell contracts. Thus, the net position of non-commercial traders decreased by 10.7K contracts over the week. The net position indicator has been steadily increasing over the past 11 months and remains high. Alongside, the British pound has been appreciating in the long-term prospect. Currently, we are approaching a point where the net position has grown too much to anticipate a further climb of the pair. We foresee a prolonged and extended decline of the sterling ahead. COT reports suggest a slight strengthening of the British currency, but it is getting harder to believe in it day after day. It's complicated to determine on what conditions the market might resume buying. Sell signals are coming into being on 4-hour and 24-hour timeframes.
The British currency has jumped by a total of 2,800 pips from its absolute lows reached last year. All in all, it has been a stunning rally without a strong downward correction. Thus, further growth would be utterly illogical. We're not against the upward trend. We just believe GBP/USD needs a good downward correction first. The fundamental backdrop is perceived by the market in a biased manner. Indeed, the market neglects a plethora of positive data in favor of the US dollar. The Non-commercial group currently holds a total of 97K buy contracts and 48.7K sell contracts. We remain skeptical about the long-term growth of the British currency. Lately, the market has been planning short positions.
Analysis of GBP/USD 1H
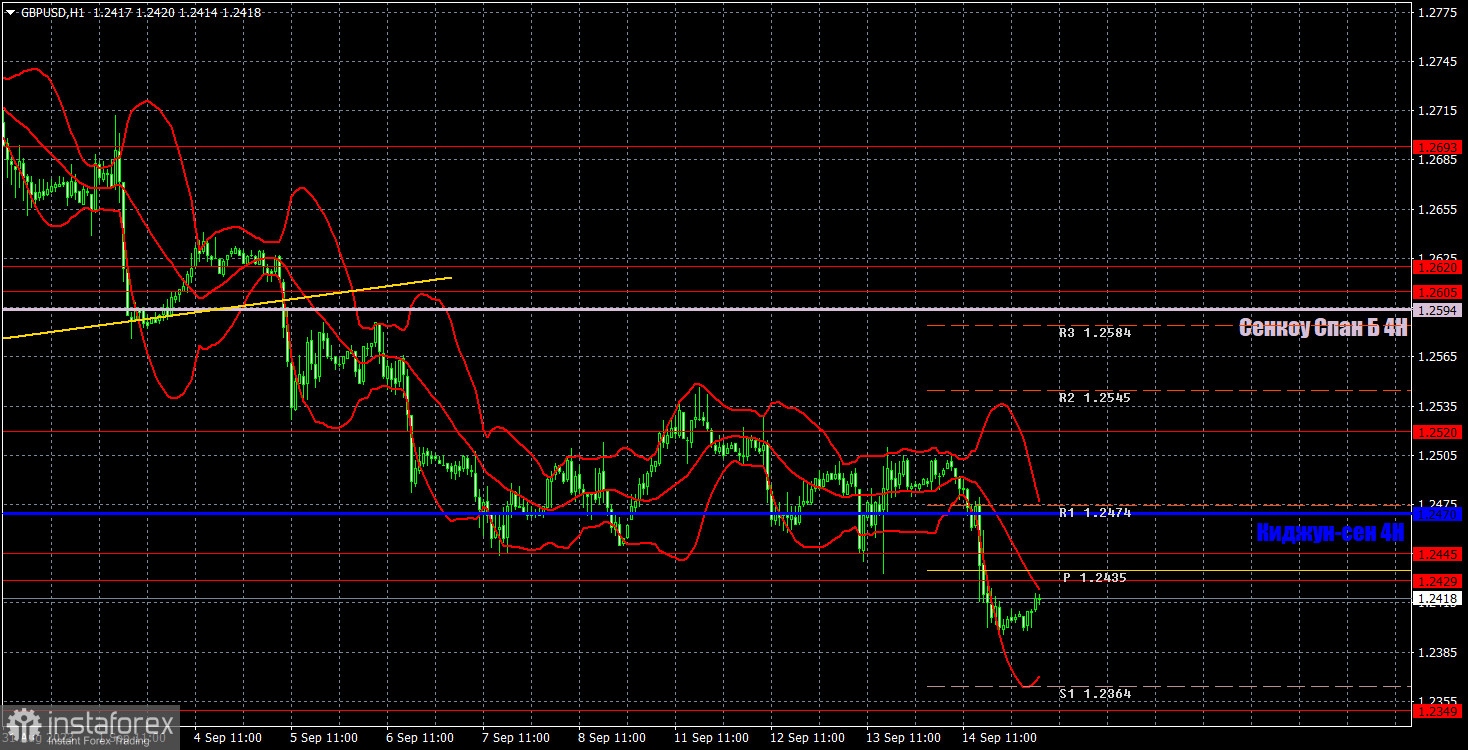
On the 1-hour timeframe, the GBP/USD pair continues its downward movement. The pound sterling is still poised to decline and can't correct upwards. Traders are now sitting on the sidelines of the Bank of England and FOMC meetings next week. The British pound may very well sink even lower as the market is currently not interested in the uptrend for obvious reasons.
For September 15, we highlight the following key levels: 1.2269, 1.2349, 1.2429-1.2445, 1.2520, 1.2605-1.2620, 1.2693, 1.2786, and 1.2863. The Senkou Span B line (1.2594) and Kijun-sen (1.2470) might also be sources of signals. Bounces and breakouts of these levels and lines can be used as signals. The Stop Loss level is recommended to be set at breakeven when the price moves 20 pips in the right direction. The Ichimoku indicator lines may move throughout the day, which should be taken into account when identifying trading signals. The chart also includes support and resistance levels that can be used for profit-taking on positions.
On Friday, there are no significant publications scheduled in the UK. In the US, there will be reports on consumer sentiment from the University of Michigan and industrial production. Both are reports of secondary importance and are unlikely to arouse a strong market response.
What's on charts
Price levels of support and resistance (resistance / support) are plotted by thick red lines, near which the movement may end. They are not sources of trading signals.
The Kijun-sen and Senkou Span B lines are the Ichimoku indicator lines transferred to the 1-hour timeframe from the 4-hour timeframe. They are strong lines.
Extreme levels are thin red lines, from which the price bounced or dipped earlier. They are sources of trading signals.
Yellow lines are trend lines, trend channels and any other technical patterns.
Indicator 1 on the COT charts means the size of the net position of each category of traders.
Indicator 2 on the COT charts means the size of the net position for the Non-commercial group.


