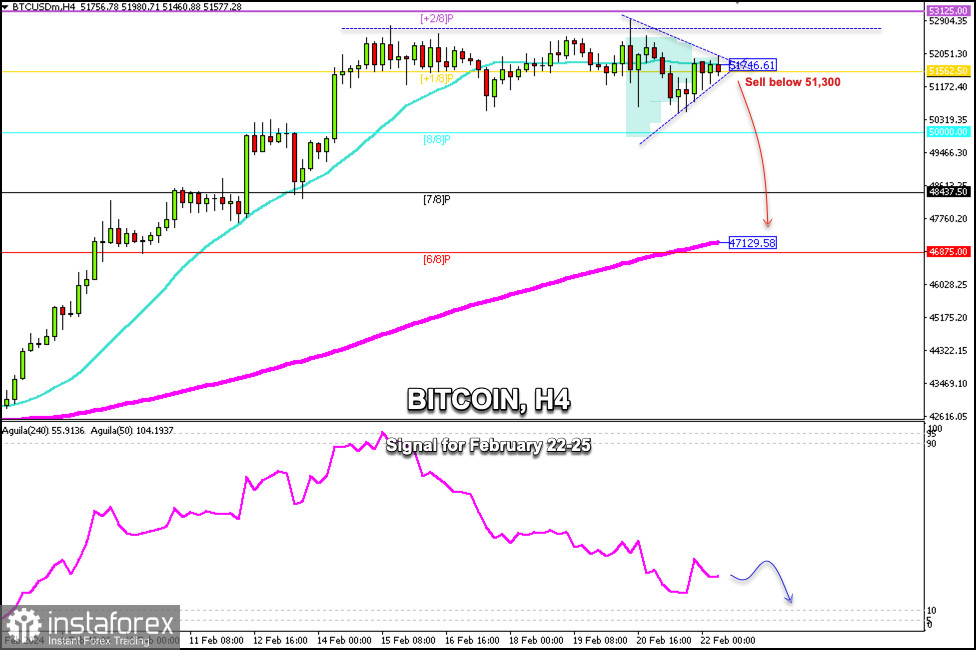
Bitcoin is trading around 51,600, a level that coincides with +1/8 Murray and the 21 SMA. After Bitcoin reached $53,000 on February 13, we observe that it has been consolidating and has been trading between 53,000-50,500 for several days.
On the H4 chart, we observe the formation of a symmetrical triangle pattern. If a break occurs below this pattern around 51,300, we could expect a bearish acceleration in the coming days and BTC could reach the 200 EMA located at 47,129.
On the contrary, should Bitcoin break out of the symmetrical triangle pattern and consolidate above 51,800, we could expect it to continue rising until the price reaches the key +2/8 Murray level located at 53,125.
The eagle indicator is showing oversold signs and BTC is likely to resume its bullish cycle in the coming days which could cause a strong movement in the cryptocurrency. The price could even surpass $53,000 and reach the psychological level of 55,000.
Our outlook could be negative if Bitcoin consolidates below 51,560. Below this area, there is strong bearish pressure and we could expect the price to reach the psychological level of $50,000, 48,437 and finally, 46,875


