


The EUR/USD currency pair is currently presenting a fascinating confluence of technical bullishness and cautious market sentiment, as traders gear up for a week peppered with critical economic data releases and central bank orations that could steer market trajectories.
Key Takeaways:
- EUR/USD shows strong technical bullish signals, with the majority of indicators and moving averages suggesting upward momentum.
- Market sentiment is cautiously optimistic, with a leaning towards bullishness in the short term, as indicated by the sentiment scoreboard.
- Upcoming economic data releases and central bank speeches are poised to sway market trends, meriting traders' vigilance.

Fundamental Analysis:
Global markets are operating under a cloud of mixed sentiments. A subdued session for tech equities on Wall Street and ambivalent moods in China have contributed to a tentative atmosphere in European markets. Traders are now poised for a light schedule today, but with a keen eye on the flurry of impactful data due from the US, China, and Europe in the coming days. Notable releases include the US PCE inflation data, durable goods orders, private consumption figures, and PMI readings from the industrial sectors of the US, Europe, and China.
The day's agenda will spotlight new home sales data from the US, the Dallas Fed's regional index, and a speech from Christine Lagarde, President of the European Central Bank. Market expectations are leaning towards a deceleration in the monthly dynamics of US home sales—albeit still higher year-over-year—and a strong improvement in the Dallas Fed index, although it is anticipated to remain in negative territory.
Technical Analysis:
Turning to the chart, EUR/USD has been trading within a rising channel, underpinned by a series of bullish engulfing candlestick patterns. The Relative Strength Index (RSI) is hovering in moderate territory at 58.75, which does not suggest overbought conditions and provides room for potential upward movement.
The price is currently testing a supply zone, with the 100-period Exponential Moving Average (EMA) providing dynamic support just below. The Moving Average Convergence Divergence (MACD) is not visible on the chart, but given the bullish nature of the moving averages, one could infer positive momentum.
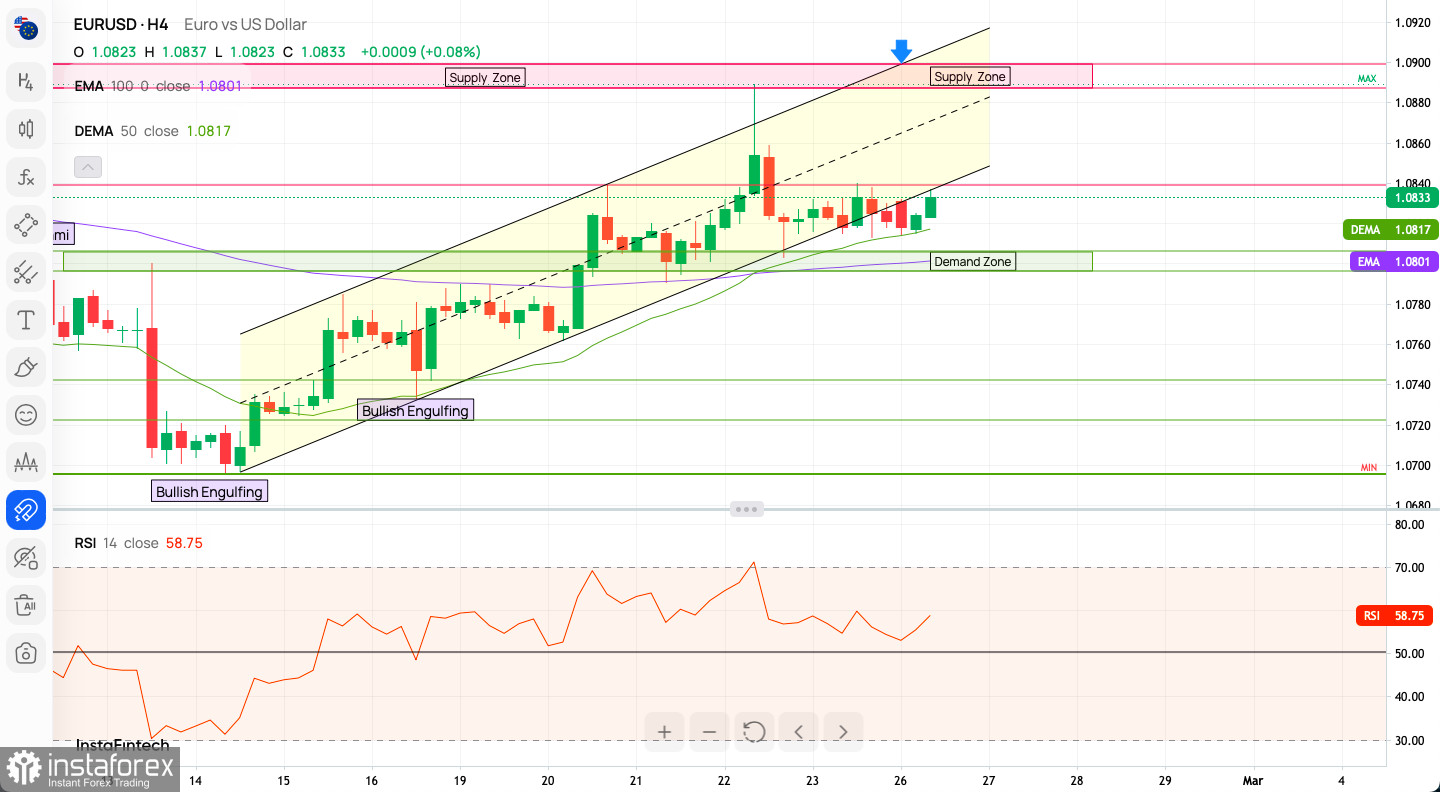
The Demand Zone lower on the chart suggests a strong area of buyer interest that could propel the pair higher should any retracements occur. The alignment of 18 out of 18 moving averages in favor of a Buy signal fortifies the bullish technical posture of the pair.
- Pivot Points Analysis:
- Pivot Point (1.0803): This level is crucial as it is the average of the high, low, and closing prices from the previous week. The price being above this level suggests a bullish sentiment for the week.
- Support Levels (S1: 1.0767, S2: 1.0726, S3: 1.0690): These levels can act as potential support zones where the price might find a floor and bounce back up. These can be areas where traders might consider buying opportunities if the price retraces.
- Resistance Levels (R1: 1.0824, R2: 1.0871, R3: 1.0935): These are levels where the price may face resistance and potentially reverse or consolidate. If the price approaches these levels, traders might look for sell signals or take profit on long positions.
- Current Price Position:
- As of the last visible price on the chart, the price is between the pivot point and R1, suggesting that the bullish momentum is testing the initial resistance level (R1).
- Strategy Incorporating Pivot Points:
- If the price remains above the pivot point and moves towards R1, this can be seen as a continuation of the bullish trend. A breach above R1 could lead to the price moving towards R2.
- If the price were to fall below the pivot point, it would be important to watch the support levels S1 and S2 for potential buy entries or reversal signs.
- Correlation with Technical Patterns:
- The demand zone marked on the chart should be considered along with S1 and S2 for stronger support confluence.
- The supply zone and upper channel resistance area correlate with R2 and R3, providing a confluence for potential resistance.
In conclusion, the price is currently in a bullish trend with the next immediate resistance level at R1 (1.0824). It's above the pivot point (1.0803), which acts as a key level for bullish sentiment. Support levels are below, which could serve as potential buying zones if tested. Always ensure proper risk management and stop-loss strategies to protect your trades.
Market Scenarios:
Bullish Scenario: A sustained break above the current supply zone could open the path towards the 1.0900 psychological level, especially if underpinned by favorable fundamental data or dovish central bank rhetoric.
Bearish Scenario: Should the upcoming economic releases disappoint or should risk sentiment deteriorate, a reversal from the supply zone and a breach below the EMA could see the pair test the lower bounds of the demand zone around 1.0800.
Trading Insights:
EUR/USD traders should remain vigilant as the pair hovers at a critical juncture. With the fundamental landscape showing potential headwinds and tailwinds, and technicals suggesting an inclination to rise, the stage is set for a market sensitive to incoming data and central bank guidance. As always, risk management and a keen eye on news flows will be paramount.
Useful Links
Important Notice
The begginers in forex trading need to be very careful when making decisions about entering the market. Before the release of important reports, it is best to stay out of the market to avoid being caught in sharp market fluctuations due to increased volatility. If you decide to trade during the news release, then always place stop orders to minimize losses.
Without placing stop orders, you can very quickly lose your entire deposit, especially if you do not use money management and trade large volumes. For successful trading, you need to have a clear trading plan and stay focues and disciplined. Spontaneous trading decision based on the current market situation is an inherently losing strategy for a scalper or daytrader.


