


EUR/USD Bulls Take Charge Amidst Economic Headwinds
Key Takeaways:
- The EUR/USD pair shows a strong bullish trend with significant buying signals from technical indicators and moving averages.
- Fundamental data indicate mixed sentiments with potential impacts from economic indicators and central bank speeches.
- Traders should watch for a possible correction due to the overbought RSI condition, despite the overall bullish market sentiment.

The forex market presents a tableau of opportunities as the European indexes open modestly lower despite an optimistic session in Asia-Pacific. The Japanese Yen shines amongst the G10 currencies, while the US Dollar lags, providing an impetus to precious metals. Today's economic calendar is light but punctuated with notable releases, particularly from the US, including durable goods orders and the Conference Board's consumer confidence index. Corporate earnings reports from Beyond Meat, Ebay, and Virgin Galactic are also on the horizon, potentially swaying market sentiments.
Fundamental Analysis: A Mixed Bag of Economic Signals
The landscape of European indexes is a dichotomy of reticence and optimism, opening slightly lower or unchanged, belying the upbeat session in the Asia-Pacific markets. The Japanese inflation slowdown was less than anticipated, bolstering the JPY as a strong contender in the G10 currencies. Meanwhile, the US Dollar's weakness augments support for precious metals.
The economic docket for the upcoming day is sparse but sprinkled with noteworthy publications, especially in the afternoon. Investors are poised for the US durable goods orders report for January and the February consumer confidence index from the Conference Board. Additionally, financial reports from Beyond Meat, Ebay, and Virgin Galactic are slated for release, potentially influencing market dynamics.
Technical Analysis:
The EUR/USD pair's technical indicators signal a bullish stance with a majority indicating a 'Buy'. All 18 moving averages are in unison, pointing to a 'Buy' signal as well. The sentiment scoreboard tilts in favor of the bulls, bolstered by last week's persistently bullish outlook and a neutral sentiment in the last three days.
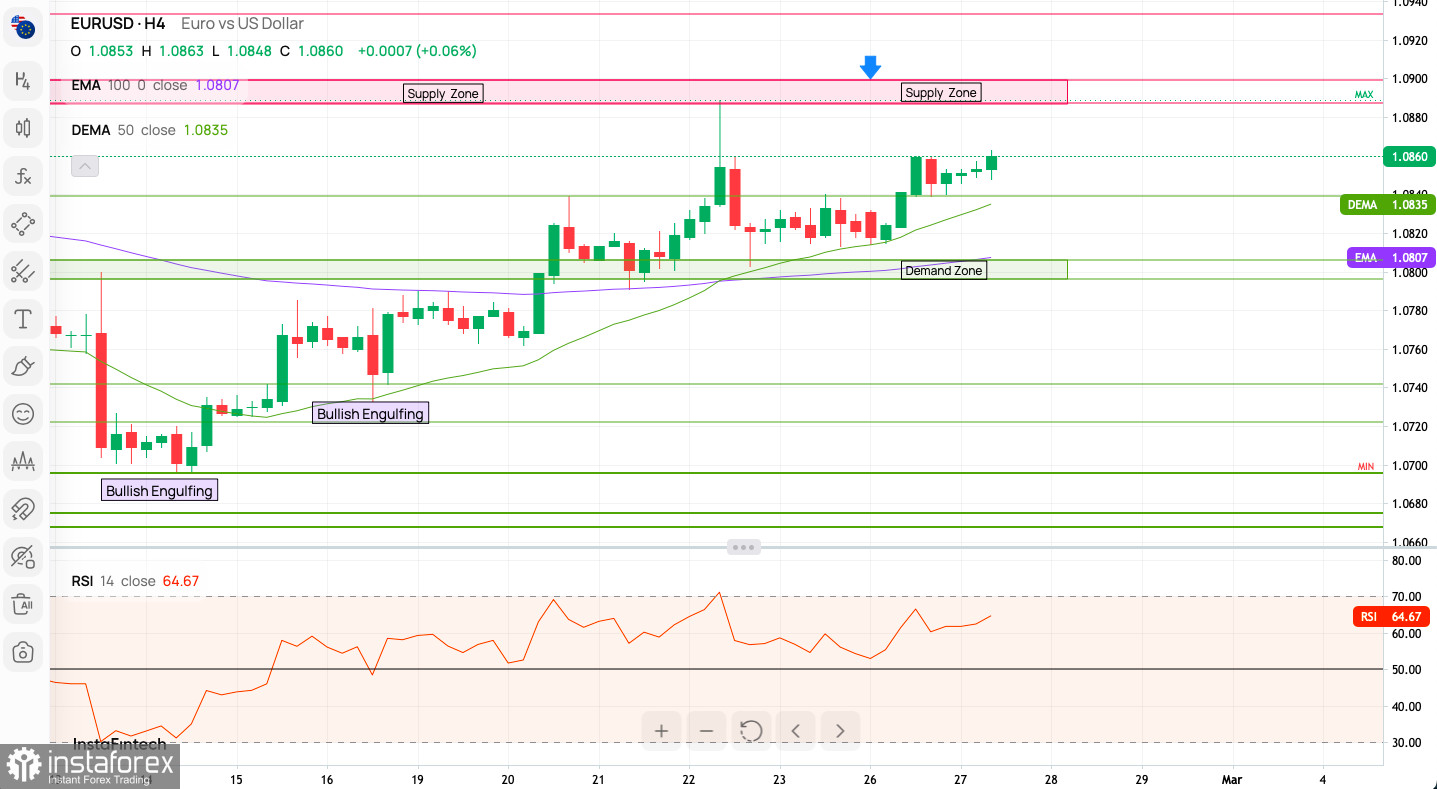
Current Price Action: The EUR/USD has been on a steady uptrend as indicated by the series of higher lows and higher highs within the 4-hour time frame. The current price is nestled above both the Exponential Moving Average (EMA) 100 and the Double Exponential Moving Average (DEMA) 50, which suggests bullish momentum. The presence of Bullish Engulfing candlestick patterns further reinforces the upward trajectory.
Key Levels:
- Support: The chart displays a well-defined demand zone, which could potentially offer strong support to prices if a retest occurs. The EMA 100, sitting at 1.0807, followed closely by the DEMA 50 at 1.0835, also serves as dynamic support levels.
- Resistance: The supply zone, located above the current price level, represents a significant area of resistance that could stall or reverse the current uptrend. The 'MAX' line delineates a key resistance level which, if broken, could indicate a potential continuation of the bullish trend.
Indicators:
- RSI: The Relative Strength Index is at 64.67, suggesting that while the market is leaning towards overbought territory, there is still room for upward movement before reaching extreme levels.
- Volume: While the volume is not explicitly shown on the chart, the size and formation of the Bullish Engulfing patterns may imply strong buying pressure during those periods.
Trend Analysis: The pair is within an ascending channel, highlighting a bullish sentiment. The consistent higher lows suggest that buyers are entering at each dip, maintaining the uptrend.
Moving Averages: Both the EMA and DEMA are trending upwards, aligning with the price movement, which supports the bullish sentiment. The fact that the price is above these moving averages further validates the strength of the current trend.
Candlestick Patterns: The Bullish Engulfing patterns located at the lower end of recent price action signify strong buying interest. These patterns, where a larger bullish candle completely engulfs the body of the previous bearish candle, typically indicate a shift in momentum to the upside.
Potential Scenarios:
- Continuation of Uptrend: If the demand zone holds and buying pressure continues, the EUR/USD pair may test and possibly break through the supply zone, targeting the 'MAX' resistance level.
- Price Retracement: Should the pair experience a pullback, the EMA and DEMA will be the first levels of dynamic support. A deeper retracement could see the pair test the lower boundary of the demand zone.
Useful Links
Important Notice
The begginers in forex trading need to be very careful when making decisions about entering the market. Before the release of important reports, it is best to stay out of the market to avoid being caught in sharp market fluctuations due to increased volatility. If you decide to trade during the news release, then always place stop orders to minimize losses.
Without placing stop orders, you can very quickly lose your entire deposit, especially if you do not use money management and trade large volumes. For successful trading, you need to have a clear trading plan and stay focues and disciplined. Spontaneous trading decision based on the current market situation is an inherently losing strategy for a scalper or daytrader.


