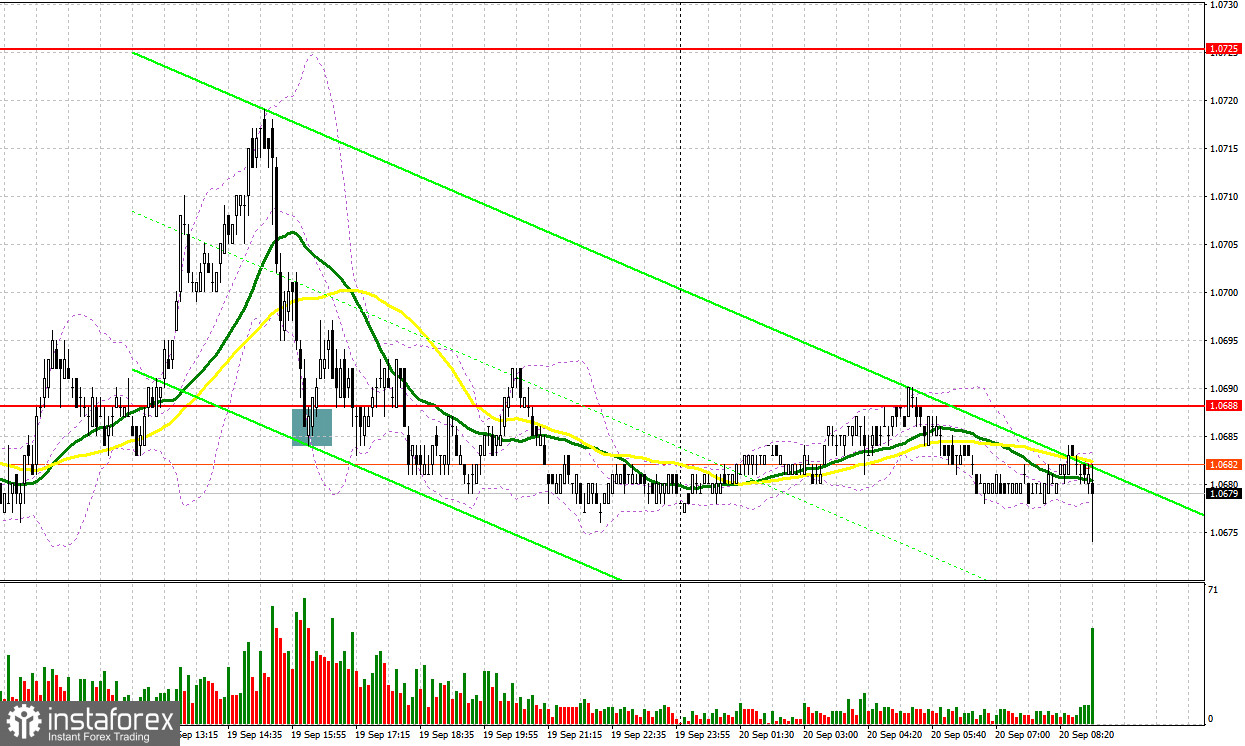
Yesterday, the pair formed several entry signals. Let's see what happened on the 5-minute chart. In my morning review I mentioned the level of 1.0695 as a possible entry point. A rise and a false breakout on this mark produced a sell signal, but after falling by 10 pips, demand for risk assets returned, which led to another test and breakout of 1.0695 in continuation of the bullish correction. In the afternoon, buying on a false breakout from 1.0688 resulted in a 10-pip rise, afterwards the pair was under immense pressure.

For long positions on EUR/USD:
The main item on today's agenda is the Federal Reserve meeting, which may also go for another quarter-point rate hike as part of the fight against high inflation in the country. Given how much talk there is now around rising energy prices and oil prices in particular, it is possible that the Fed may also downwardly revise its inflation forecasts. This could exert downward pressure on the euro. But all this is for the second half of the day, and for now I advise you to focus on the speeches of European Central Bank Executive Board members Fabio Panetta, Isabel Schnabel and Frank Elderson. Let's listen to what they have to say now that oil prices reach record highs, and inflation in the region, while having decreased somewhat, remains relatively high.
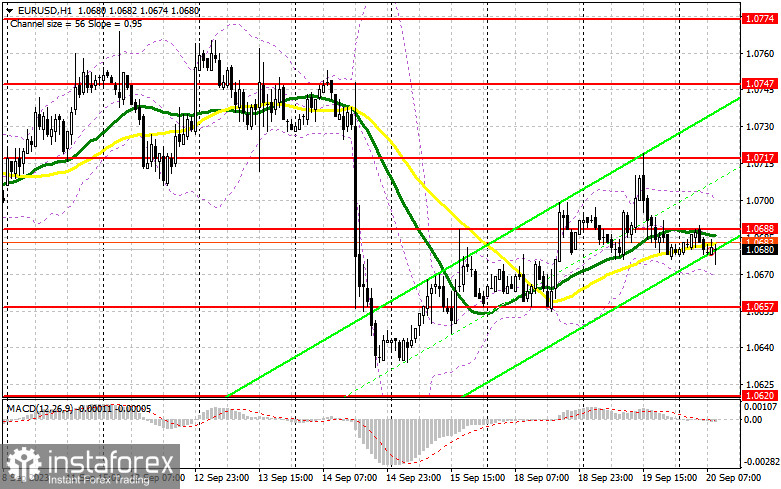
Considering these factors, I plan to act on a dip in EUR/USD after it forms a false breakout around the nearest support at 1.0657. A false breakout around that mark will confirm the entry point for long positions. The immediate target in sight is the resistance at 1.0688. A breakout and a downward test of this level, in the absence of significant eurozone data, will boost demand for the euro, offering a chance for a correction and a surge to 1.0717. The ultimate target would be the 1.0747 area, where I intend to lock in profits. If EUR/USD declines and there is no activity at 1.0657, which is quite possible ahead of the Fed meeting, bears will regain market control. Only the formation of a false breakout around 1.0620 will give a signal to buy the euro. I will open long positions immediately on the rebound from 1.0588, aiming for an upward correction of 30-35 points within the day.
For short positions on EUR/USD:
Sellers continue to dominate the market, which they proved yesterday afternoon after a strong report on the real estate market. All they need to focus on is defending the the nearest resistance at 1.0688, which is in line with the bearish moving averages. A false breakout and consolidation below this range, as well as an upward retest, do I anticipate another sell signal with a target at 1.0620 - a new monthly low, where I expect significant buyer activity. The furthest target is the 1.0588 area, where I plan to take profit. If EUR/USD moves upwards during the European session and bears are absent at 1.0688, bulls will have a chance to recover, but the scale of growth will depend on the Fed's decisions. In such a scenario, I would delay short positions until the price hits the new resistance at 1.0717. I would also consider selling there but only after an unsuccessful consolidation. I will open short positions directly on a rebound from the high of 1.0747, considering a downward correction of 30-35 pips.

COT report:
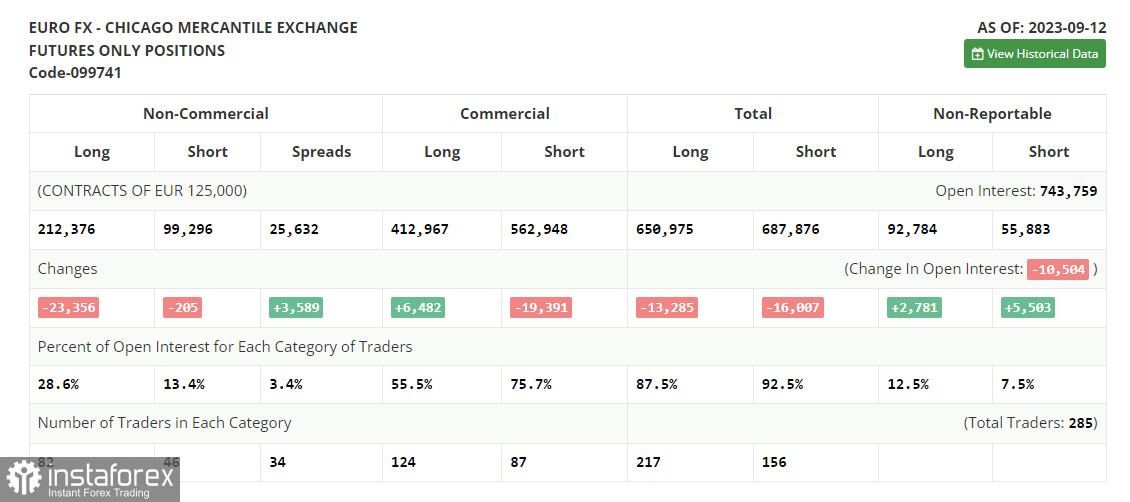
The COT report for September 12 revealed a sharp drop in long positions and a modest decline in the long ones. This decline can be attributed to some significant negative developments in the Eurozone economy and a downward revision of the GDP for the second quarter. Despite these setbacks, the European Central Bank (ECB) made a decision to hike interest rates. Such a move in the given scenario could have unfavorable implications in the near term and it might have triggered a sharp depreciation of the European currency. In the coming days, all eyes will be on the Federal Reserve's meeting. Should the committee also decide to increase rates, the euro could face further declines against the dollar. Therefore, it would be wise to exercise caution before making any purchases in the current environment. The COT report indicates a drop in non-commercial long positions by 23,356 to 212,376. On the other hand, non-commercial short positions saw a minor decrease of 205, standing at 99,296. Consequently, the spread between long and short positions expanded by 6,589. The closing price fell to 1.0736 compared to the previous value of 1.0728, signaling a bearish market trend.

Indicator signals:
Moving averages:
Trading is taking place around the 30-day and 50-day moving averages, indicating a sideways market trend.
Please note that the time period and levels of the moving averages are analyzed only for the H1 chart, which differs from the general definition of the classic daily moving averages on the D1 chart.
Bollinger Bands
If EUR/USD declines, the indicator's lower border near 1.0670 will serve as support.
Description of indicators:
• A moving average of a 50-day period determines the current trend by smoothing volatility and noise; marked in yellow on the chart;
• A moving average of a 30-day period determines the current trend by smoothing volatility and noise; marked in green on the chart;
• MACD Indicator (Moving Average Convergence/Divergence) Fast EMA with a 12-day period; Slow EMA with a 26-day period. SMA with a 9-day period;
• Bollinger Bands: 20-day period;
• Non-commercial traders are speculators such as individual traders, hedge funds, and large institutions who use the futures market for speculative purposes and meet certain requirements;
• Long non-commercial positions represent the total number of long positions opened by non-commercial traders;
• Short non-commercial positions represent the total number of short positions opened by non-commercial traders;
• The non-commercial net position is the difference between short and long positions of non-commercial traders.


