EUR/USD:
Yesterday, the U.S. S&P 500 was down by another 1.64%, after losing 0.94% on Wednesday. Meanwhile, the dollar index only rose by 0.26%, and U.S. government bond yields increased. On the one hand, this is a paradoxical situation, but on the other hand, this divergence can be seen as a "shake-up" in the stock market and later on it could rise further. Along with it, risk currencies will also rise.

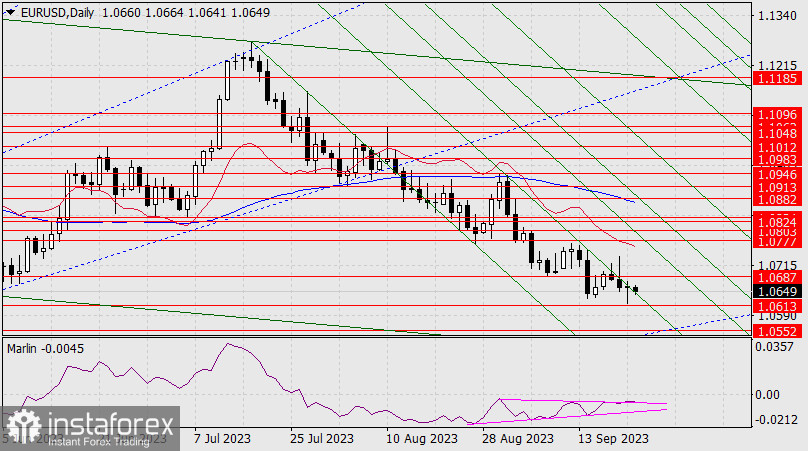
On the daily chart, the euro opened the day above the first Fibonacci channel line, indicating an intention to test the 1-2 nearest ranges of this channel. For example, the target level is 1.0803. The signal line of the Marlin oscillator has left its own wedge and has moved upward, indicating the intention to enter the positive territory and continue the upward movement.

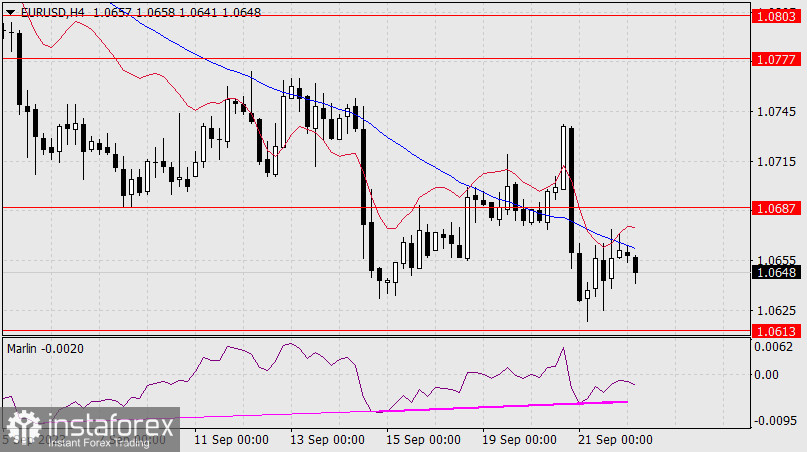
On the 4-hour chart, convergence has formed between the price and the oscillator (thick line), or a double elongated convergence has been confirmed. At the moment, the price is struggling with the resistance of the MACD indicator line. A break above yesterday's high at 1.0674 would be a sign that the price is aiming for the level of 1.0687. A consolidation above it would create conditions for growth towards 1.0803. The level of 1.0777 serves as an intermediate level. To resume the decline, the price needs to break below the support at 1.0613, which would open the way to the target at 1.0552.


