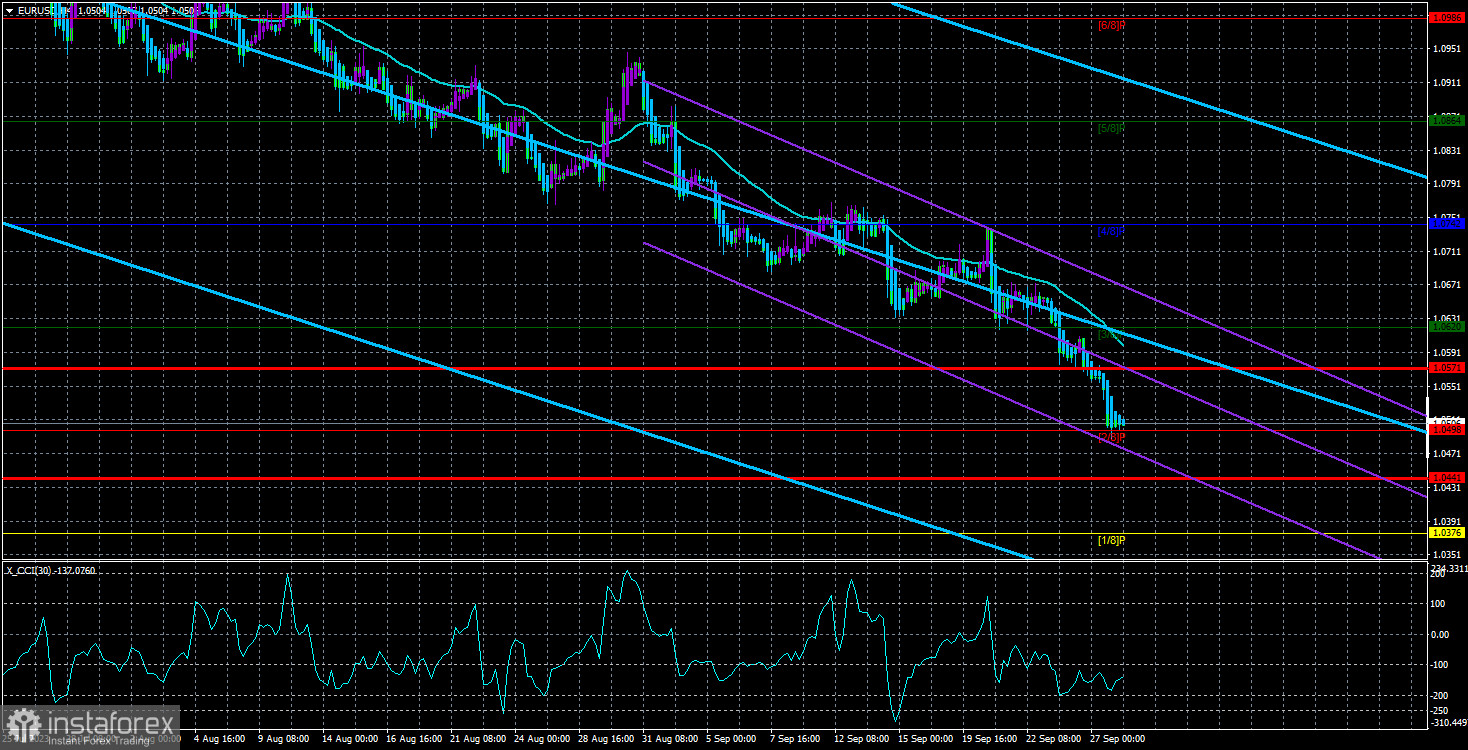
The EUR/USD currency pair continued to decline throughout Wednesday. Although it would be more accurate to say that it accelerated in its descent. To be honest, you can explain anything on the market, but the big question is whether this explanation is invented or truly justified. For example, why did the European currency fall yesterday? To answer this question, we should remember that the euro has been falling for two months now. While initially we observed occasional corrections and pullbacks, now the movement is practically one-sided. Take note. Furthermore, the ECB raised the key interest rate at the last meeting but made it clear that this tightening could be the last. Then the Monetary Policy Committee made statements, and most of them confirmed a high probability of the key interest rate hike ending in September.
What's the result? The European currency, which had been rising for about a year with 5–6 months of groundless growth, has been falling for two consecutive months now. There are plenty of reasons for the decline, as we can see, but let's return to the question of the reasons for the fall on Wednesday. It's quite simple – there were none. We mean local, intraday reasons. The fundamental backdrop for the euro remains unfavorable, and traders didn't notice it for a long time, but the "fairy tale" had to end sooner or later. Therefore, the reason for yesterday's decline was not another statement by an ECB member or a report on orders for durable goods in the US. The market is currently "bearish," and that's all there is to it.
In the 24-hour timeframe, you can best understand what's happening in the market right now. The price has settled below the Fibonacci level of 38.2%–1.0609 and now has no obstacles until the level of 1.0198 (23.6% according to Fibonacci). We still expect to see at least a small correction, but it's very difficult to say when it will begin. So far, there are no signs of it starting.
Elderson gave the euro a chance, but the market didn't even notice it. As mentioned earlier, practically all officials from the ECB who have spoken recently have talked about the need to keep the rate at its current level for a long time rather than tightening. However, there were a few who allowed for a rate hike by the end of the year. Yesterday, Frank Elderson stated in an interview that the ECB has not made a final decision on tightening and that the rate could still go up by the end of the year. Earlier, it became known that the regulator could tighten only if inflation began to accelerate again. Mr. Elderson also stated that the regulator is determined to fulfill its mandate of price stability and is doing everything possible for it. As for "everything possible," Mr. Elderson was a bit misleading because a rate of 4.5% is clearly not "everything possible." But what can you do if the EU economy could slide into recession with further rate hikes?
Thus, even Elderson's relatively "hawkish" comment had no impact on the bearish market sentiment. As we've said before, ECB governing council members' speeches have a background impact on the market rather than an immediate one. In general, the rhetoric of ECB representatives is "dovish." So it's not surprising that the overbought euro continues to fall, as we warned since the beginning of 2023. Today, there will be some interesting events in the US and the EU, but they are also unlikely to be able to change the market sentiment to the opposite. For now, the Euro may continue to slide downward.

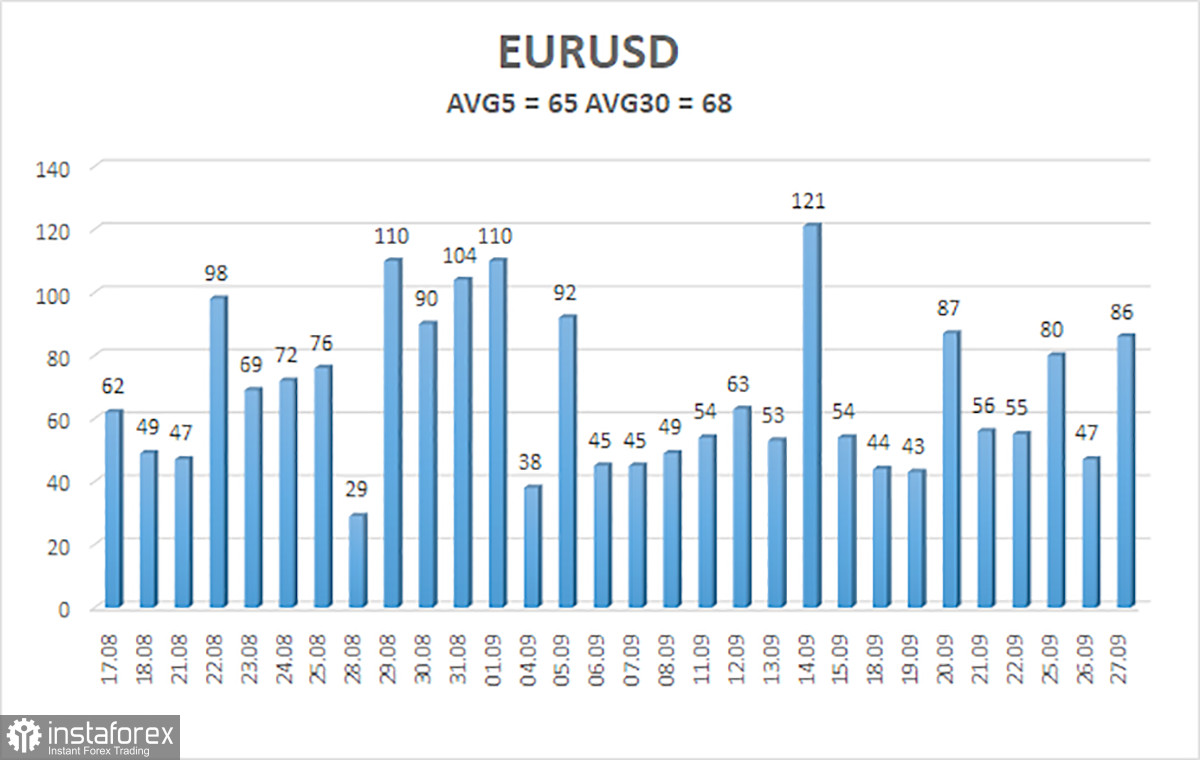
The average volatility of the EUR/USD currency pair over the last 5 trading days as of September 28th is 65 points and is characterized as "average." Therefore, we expect the pair to move between the levels of 1.0441 and 1.0571 on Thursday. A reversal of the Heiken Ashi indicator upwards will indicate a new attempt to correct slightly.
The nearest support levels are:
S1 – 1.0498
S2 – 1.0376
S3 – 1.0254
Nearest resistance levels:
R1 – 1.0620
R2 – 1.0742
R3 – 1.0864
Trading recommendations:
The EUR/USD pair maintains a downtrend and continues to move south. Currently, it is advisable to stay in short positions with targets at 1.0441 and 1.0376 until the price consolidates above the moving average. Long positions can be considered if the price consolidates above the moving average with a target of 1.0742.
Explanations for the illustrations:
Linear regression channels – help determine the current trend. If both are pointing in the same direction, it means the trend is currently strong.
Moving average line (settings 20.0, smoothed) – determines the short-term trend and direction for trading.
Murray levels – target levels for movements and corrections.
Volatility levels (red lines) – the probable price channel in which the pair will trade in the coming day, based on current volatility indicators.
CCI indicator – its entry into oversold territory (below -250) or overbought territory (above +250) indicates an impending trend reversal in the opposite direction.


