EUR/USD

Higher Timeframes
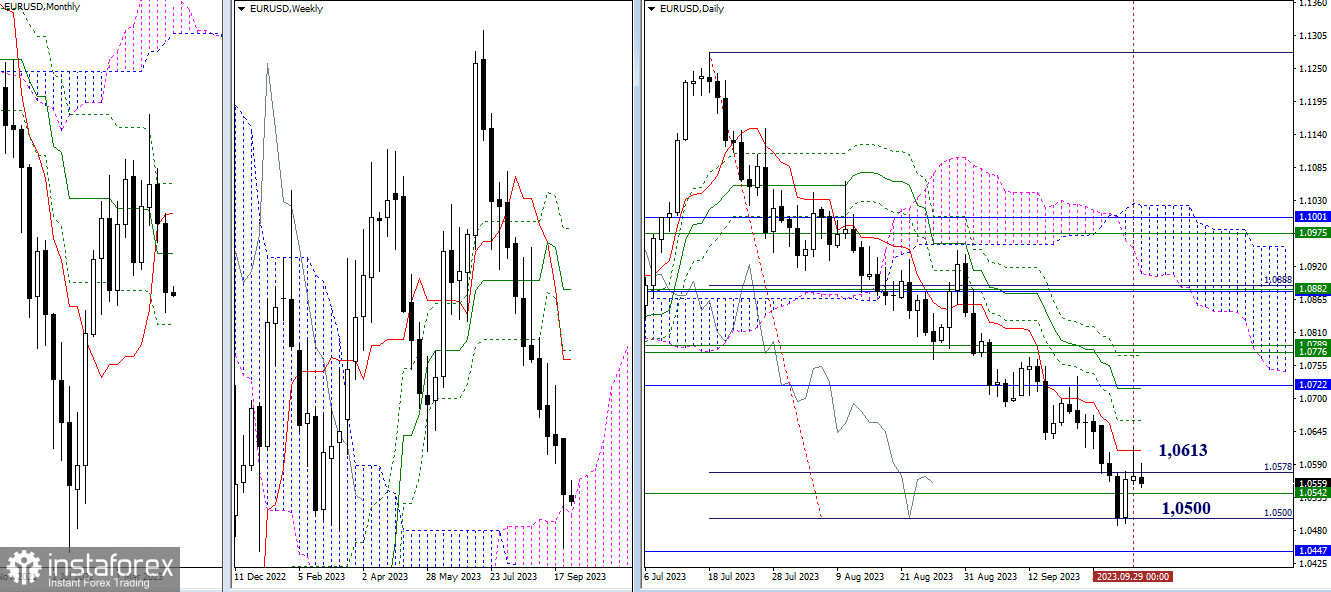
Bearish players took a pause after achieving the 100% daily target for breaking through the Ichimoku cloud at 1.0500. It's worth noting that the target coincides with the testing of the psychological level at 1.0500 and the upper boundary of the weekly Ichimoku cloud at 1.0542. As a result, this led to a rapid development of an upward correction, which has already reached its first target—the daily short-term trend at 1.0613.
From all the above, we can conclude that the current situation does not favor extensive activity. We are likely to expect some uncertainty and indecision in the coming days. The one who regains strength first will continue the movement. For bearish players at this point, to reach their next target of the monthly support at 1.0447, they need to break through the daily target at 1.0500 and the upper boundary of the weekly cloud at 1.0542.
If bullish players decide to continue the corrective rise after passing the resistance of the daily short-term trend at 1.0613, they will aim for the area of 1.0717 – 1.0722, where the daily and monthly medium-term trends have merged their efforts. Intermediate resistance on this path may come from the daily Fibonacci Kijun at 1.0664.

H4 – H1
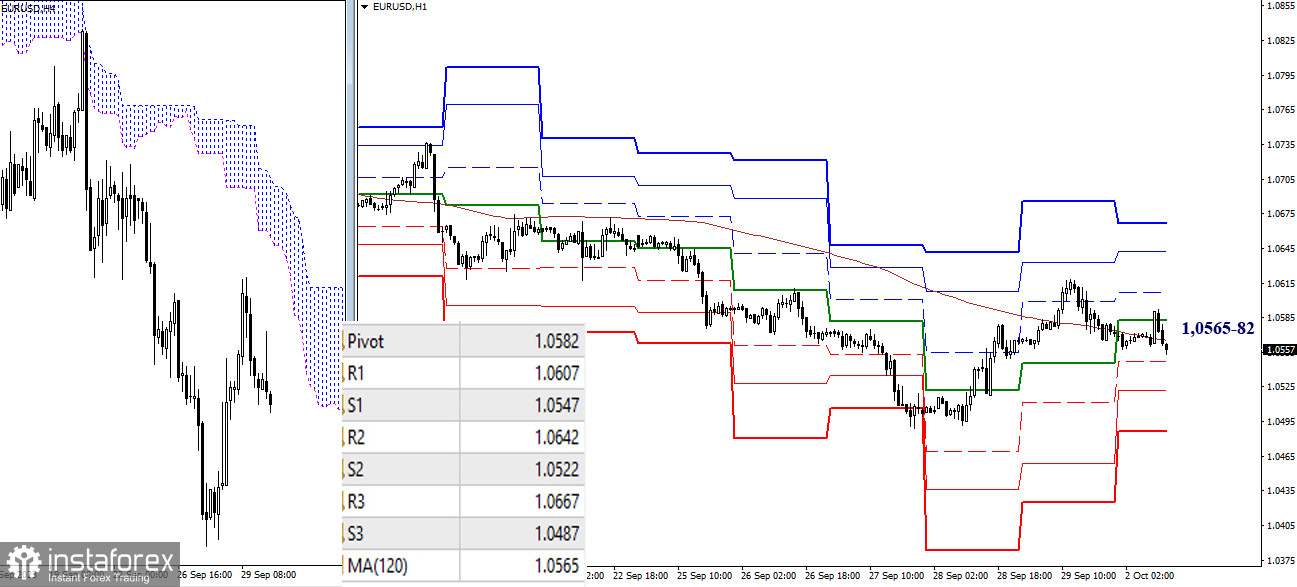
On the lower timeframes, the euro is currently in the attraction and influence zone of the weekly long-term trend at 1.0565. Trading below this level favors the strengthening of bearish sentiment. Intraday reference points are the support levels of the classic pivot points (1.0547 – 1.0522 – 1.0487). Trading above the moving average will support a recovery in bullish positions. Intraday, bullish players are expected to encounter resistance at the classic pivot points (1.0607 – 1.0642 – 1.0667).
***
GBP/USD

Higher Timeframes
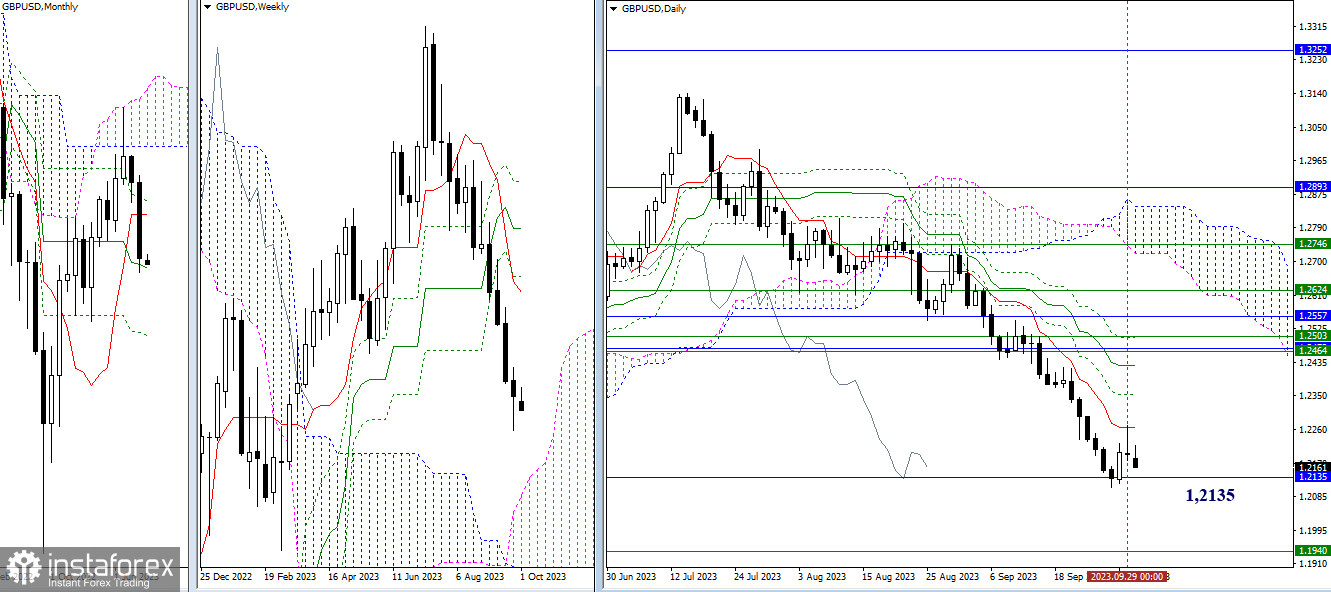
The testing of the monthly medium-term trend at 1.2135 in the September candlestick pattern was reflected only by a slight lower shadow. Nonetheless, the strength of the level is capable of holding the market for a longer period. In the development of an upward correction, the first resistance to come into play will be the death cross on the daily Ichimoku cloud (1.2265 – 1.2352 – 1.2427 – 1.2502). In the current conditions, the daily cross is strengthened by the short-term trends of the week (1.2462) and the month (1.2471). In the event of breaking the monthly support at 1.2135, the interest of bearish players will shift towards the upper boundary of the weekly cloud, currently located around 1.1940.

H4 – H1
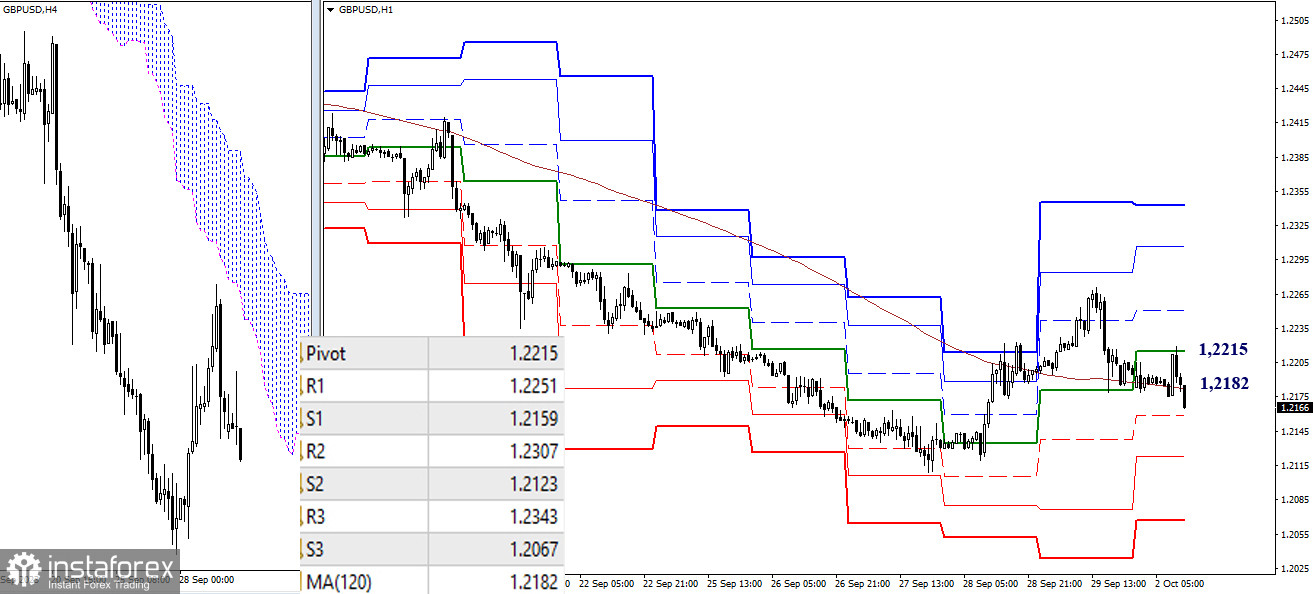
At present, actions are developing with the participation of the weekly long-term trend at 1.2182. This level is crucial and determines the current balance of power on the lower timeframes. Owning this level creates a significant advantage for one side. Today, in the event of a decline, intraday references can be the support levels of the classic pivot points (1.2159 – 1.2123 – 1.2067). In the case of an upward movement, the resistance levels of the classic pivot points (1.2251 – 1.2307 – 1.2343) will come into play.
***
The technical analysis of the situation uses:
Higher timeframes - Ichimoku Kinko Hyo (9.26.52) + Fibo Kijun levels
Lower timeframes - H1 - Pivot Points (classic) + Moving Average 120 (weekly long-term trend)


