


EUR/USD
Higher Timeframes
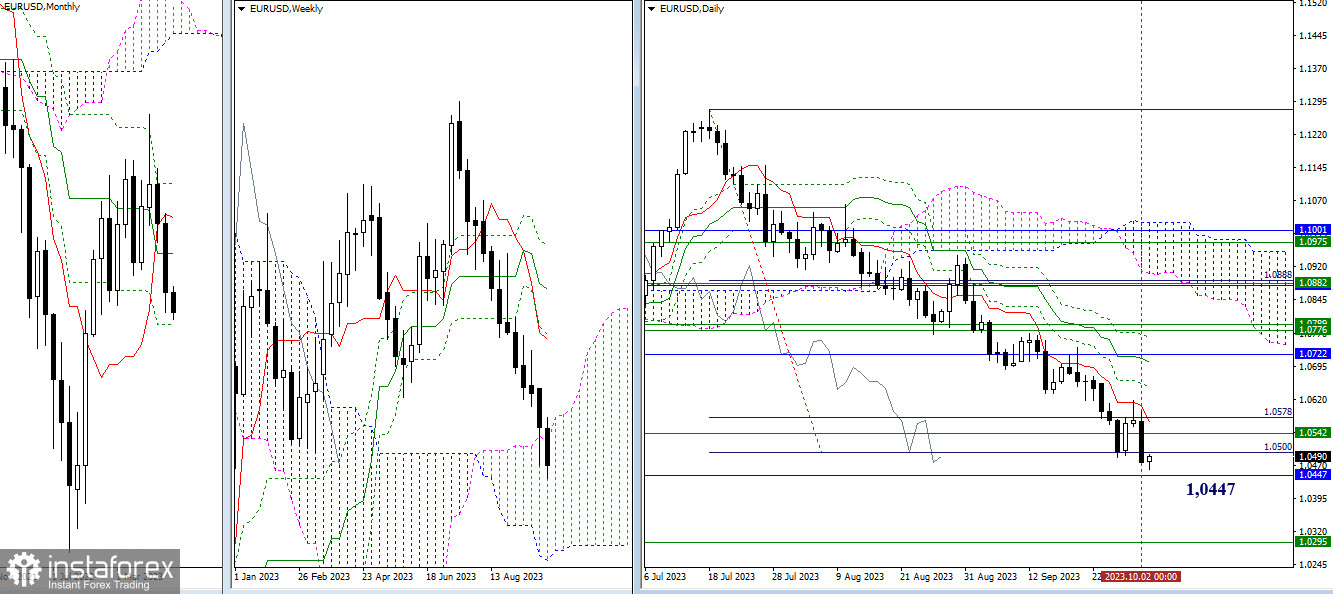
Sellers didn't hesitate for long; they completely nullified all of the opponent's achievements yesterday, updating the previous week's low. The daily close below significant supports (1.0500 - 1.0542) shifted attention to the monthly boundary at 1.0447. If bears find this insufficient, the next target is currently at 1.0295 (the lower boundary of the weekly cloud). The levels 1.0500 - 1.0542 can still attract buyers' activity. The daily short-term trend (1.0568) may join these resistance levels.
H4 - H1
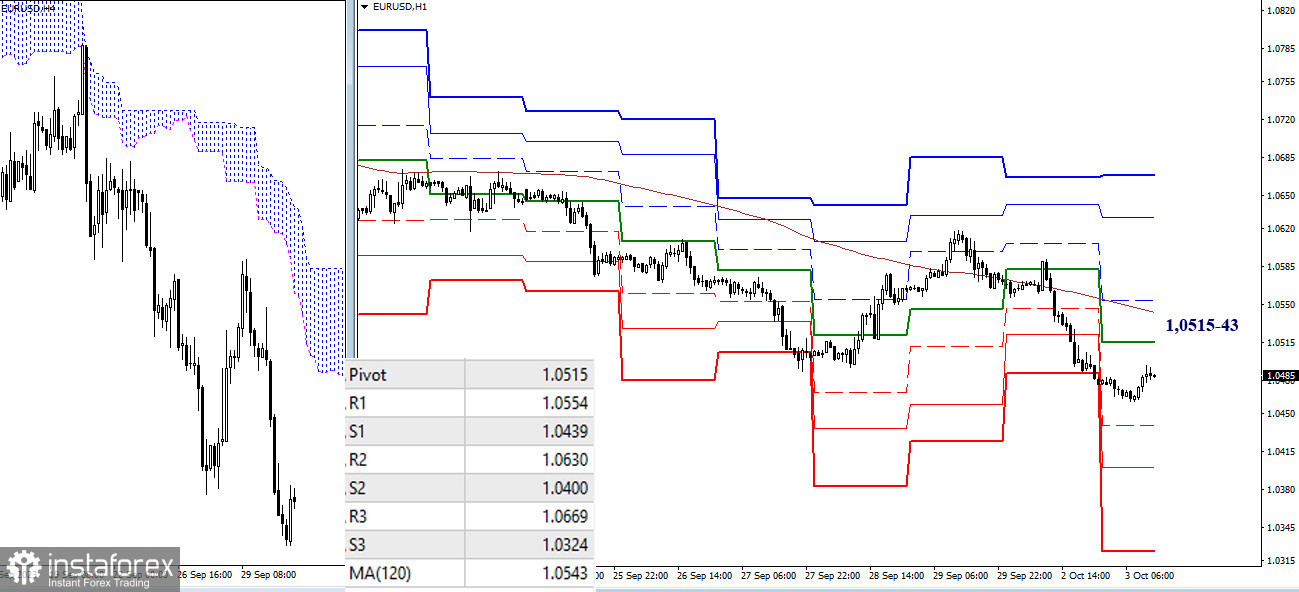
On the lower timeframes, the bearish players managed to maintain their main advantage yesterday, retaining control over the weekly long-term trend. As a result, the key levels continue to act as resistances today: 1.0515 (central pivot point of the day) - 1.0543 (weekly long-term trend). Intraday bearish targets, at the moment, are located at 1.0439 - 1.0400 - 1.0324. In case of a shift in sentiment and a break through 1.0515–43, it will pave the way for bullish activity towards the classic pivot points (1.0554 - 1.0630 - 1.0669).
***
GBP/USD
Higher Timeframes
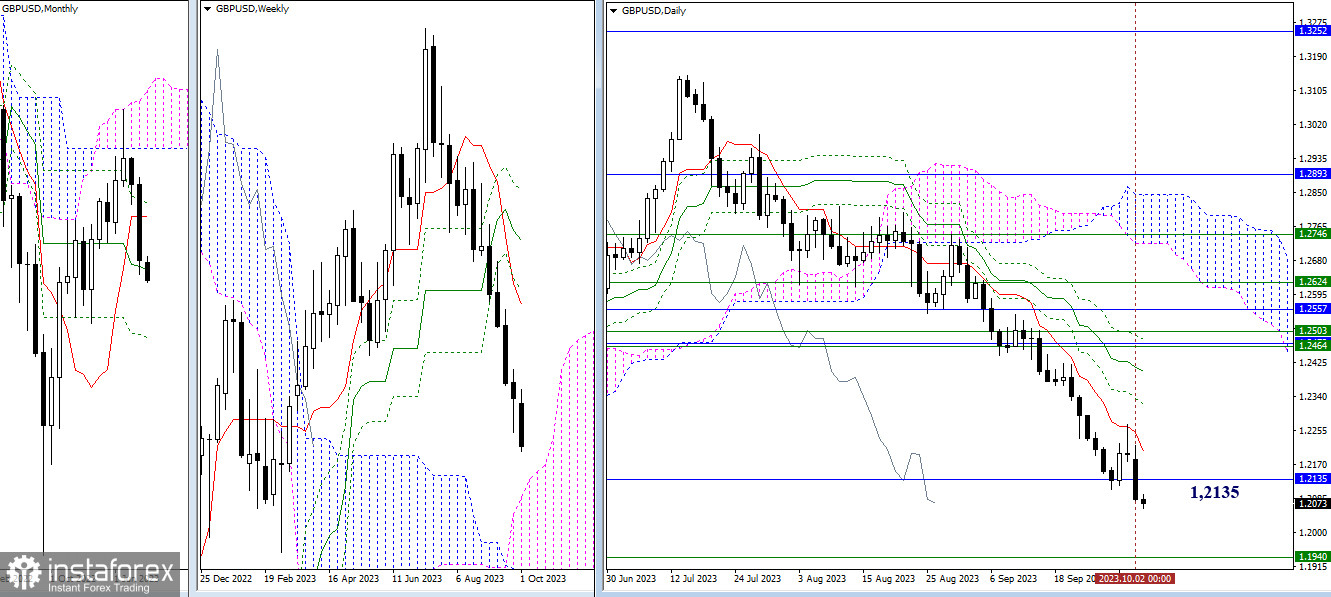
Yesterday showed that bearish players are determined. Whether they will be able to maintain their pace of decline will be seen with time. The attraction of the monthly medium-term trend (1.2135) can still exert its influence on the market. The next bearish target in this segment is currently the upper boundary of the weekly cloud (1.0940).
H4 - H1
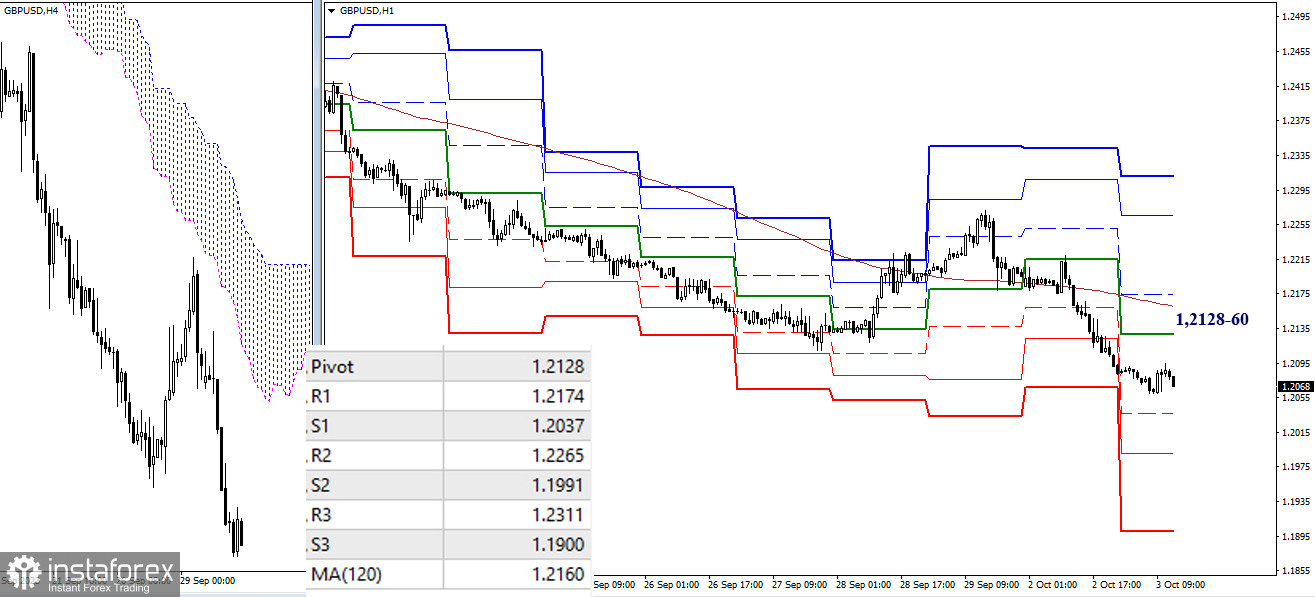
On the lower timeframes, the advantage currently belongs to bearish players, as the market is trading below today's key resistances: 1.2128 (central pivot point of the day) - 1.2160 (weekly long-term trend). The next intraday targets for decline are now at 1.2037 - 1.0991 - 1.1900 (support levels of classic pivot points). Changing the current balance of power will be aided by a break and consolidation above the resistance zone of the key levels 1.2128–60 (central pivot point + weekly long-term trend). If bullish players manage to organize this, the next intraday targets for upward movement will be the resistances of classic pivot points (1.2174 - 1.2265 - 1.2311).
***
The technical analysis of the situation uses:
Higher timeframes - Ichimoku Kinko Hyo (9.26.52) + Fibo Kijun levels
Lower timeframes - H1 - Pivot Points (classic) + Moving Average 120 (weekly long-term trend)


