


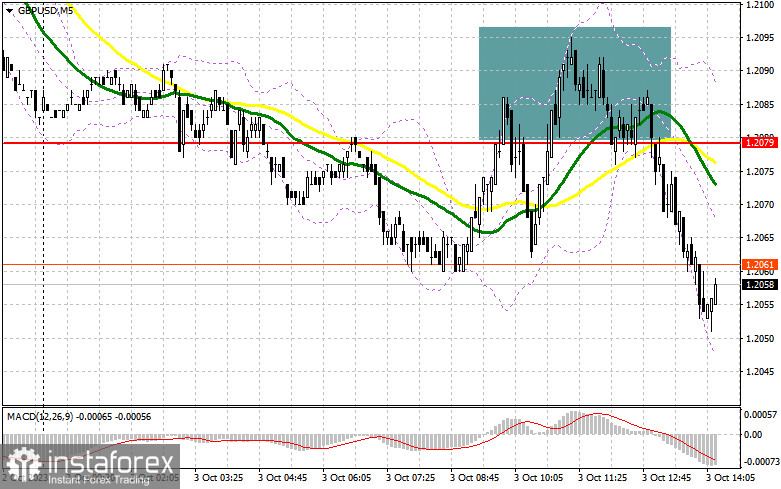
In my morning review, I mentioned the level of 1.2079 as a possible entry point. Let's have a look at what happened on the 5-minute chart. A rise to this level and its false breakout generated a sell signal in line with the bearish trend. At the moment of writing, the pair declined by 30 pips. For the second half of the day, the technical setup has been reviewed.
For long positions on GBP/USD
The pressure on the pound sterling persisted in the first half of the day amid the lack of any fundamental data. Bulls may get some support in the afternoon from FOMC member Raphael Bostick who may display a softer stance. However, the pair is unlikely to show significant growth. If Bostick reminds the market once again that the Fed interest rate may be raised further, the US dollar will strengthen. The JOLTs job openings report will be of minor interest today. If the pound stays under pressure, which is highly likely, bulls will have to assert themselves at 1.2044. A false breakout at his level will create a good entry point into long positions, aiming for a correction towards the new resistance at 1.2090. Breaking and settling above this range will bolster the buyers' confidence and generate the signal to open long positions with the target at 1.2125 where moving averages are located. The ultimate target will be the 1.2163 area where I will be looking to take profits. If the pair declines to 1.2044 without buyer activity, bearish pressure on the pound will likely increase. In this case, only the protection of the 1.1991 low and its false breakout will signal a buying opportunity. I will buy GBP/USD immediately on a rebound from the low of 1.1927, aiming for a daily intraday correction of 30-35 pips.
For short positions on GBP/USD
The pound stays under strong selling pressure and bulls can do nothing about it. It is better to act on a correction near the new resistance of 1.2090 from where the pound has bounced off today. A false breakout at this level will create an entry point into short positions, targeting the downward target at 1.2044. Breaking and retesting this level from below will deliver a serious blow to bullish positions, thugs intensifying the bearish bias and paving the way for a steeper decline to the 1.1991 support. The downward target is found at 1.1927 where I will be taking profit. If GBP/USD rises and bears show no activity at 1.2090, the new resistance level coinciding with the intraday high, bulls will get an opportunity to develop an upside correction. In this case, I will delay going short at least until a false breakout at 1.2280 occurs. If there is no downward movement there, I will sell the pound immediately on a rebound from 1.2327, targeting an intraday correction of 30-35 pips.
COT report
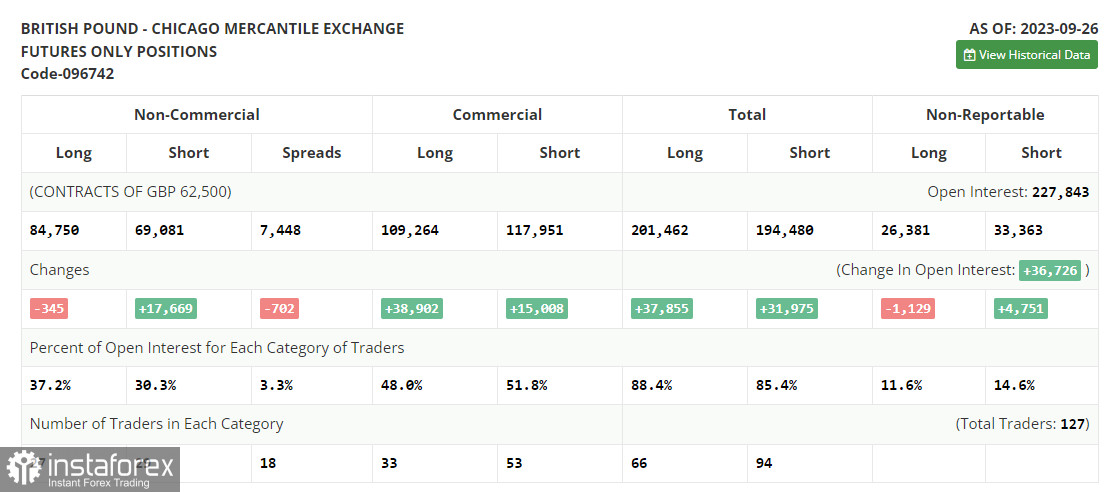
The Commitments of Traders report for September 26 indicated a reduction in long positions and a strong rise in the long ones. This suggests that the number of pound buyers is decreasing, especially after a batch of disappointing statistics reflecting weak economic growth in the UK. Considering that UK GDP may show even a sharper slowdown in the third quarter, it is not surprising why the pound is rapidly depreciating against the US dollar. The latest COT report states that long non-commercial positions fell by 345 to 84,750, while short non-commercial positions increased by 17,669 to 69,081. As a result, the spread between long and short positions narrowed by 702. The weekly closing price fell to 1.2162 from 1.2390.
Indicator signals:
Moving Averages
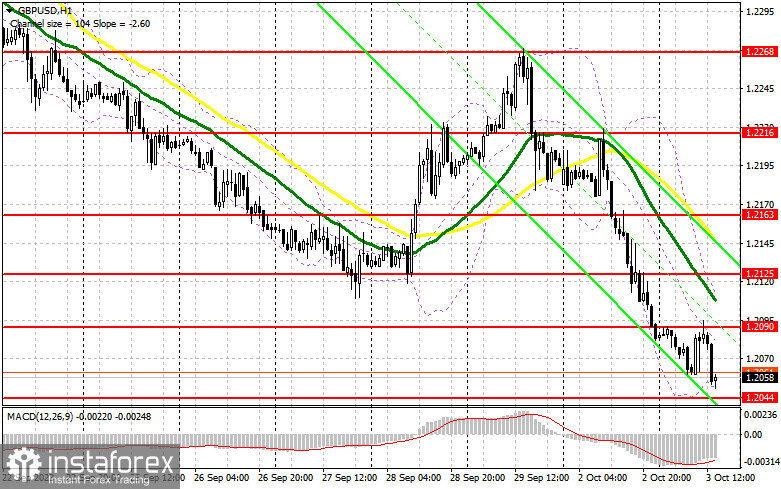
Trading below the 30- and 50-day moving averages indicates a further decline in the pair.
Please note that the time period and levels of the moving averages are analyzed only for the H1 chart, which differs from the general definition of the classic daily moving averages on the D1 chart.
Bollinger Bands
If the pair declines, the lower band of the indicator at 1.2060 will act as support.
Description of indicators:
• A moving average of a 50-day period determines the current trend by smoothing volatility and noise; marked in yellow on the chart;
• A moving average of a 30-day period determines the current trend by smoothing volatility and noise; marked in green on the chart;
• MACD Indicator (Moving Average Convergence/Divergence) Fast EMA with a 12-day period; Slow EMA with a 26-day period. SMA with a 9-day period;
• Bollinger Bands: 20-day period;
• Non-commercial traders are speculators such as individual traders, hedge funds, and large institutions who use the futures market for speculative purposes and meet certain requirements;
• Long non-commercial positions represent the total number of long positions opened by non-commercial traders;
• Short non-commercial positions represent the total number of short positions opened by non-commercial traders;
• The non-commercial net position is the difference between short and long positions of non-commercial traders.


