


Analysis of macroeconomic reports:
There are few macroeconomic events on Wednesday, but there are important data that traders can look forward to. However, it's not very clear what the market prefers at the moment. On Monday, there was a small number of important reports but both pairs traded significantly lower. On Tuesday, there was only one important report, and it had significant implications, and yet the pairs generally stood still. So, today's situation is quite uncertain. For example, the EU will release reports on the Services PMI, Producer Price Index, and Retail Sales. So which of these reports could trigger a strong market reaction? In our opinion, none of them. Perhaps, when considered altogether...
We will highlight the US reports on ADP and the ISM Services PMI, and they are capable of causing significant movement. For now, the dollar remains near its local highs and it doesn't seem like it will move far away from it.
Analysis of fundamental events:
From Wednesday's fundamental events, we can highlight the speeches of European Central Bank President Christine Lagarde, her deputy Luis de Guindos, and several other members of the monetary committee. However, how many such speeches have we seen in the last 2-3 weeks?! In general, they turn out to be the same thing: the central bank has likely ended its rate hike cycle. It's unlikely for us to receive new information from these speakers.
The same goes for Federal Reserve official Michelle Bowman. At the moment, the market has no questions regarding the future course of actions of the Fed or the ECB, so all these speeches do not hold too much significance.
General conclusion:
There are quite a number of events on Wednesday, but few of them are important. We believe that beginners should simply remember when various news are announced and they should be prepared for a change in direction during those times. Today, you should pay attention to the US data.
Basic rules of a trading system:
1) Signal strength is determined by the time taken for its formation (either a bounce or level breach). A shorter formation time indicates a stronger signal.
2) If two or more trades around a certain level are initiated based on false signals, subsequent signals from that level should be disregarded.
3) In a flat market, any currency pair can produce multiple false signals or none at all. In any case, the flat trend is not the best condition for trading.
4) Trading activities are confined between the onset of the European session and mid-way through the U.S. session, post which all open trades should be manually closed.
5) On the 30-minute timeframe, trades based on MACD signals are only advisable amidst substantial volatility and an established trend, confirmed either by a trend line or trend channel.
6) If two levels lie closely together (ranging from 5 to 15 pips apart), they should be considered as a support or resistance zone.
How to read charts:
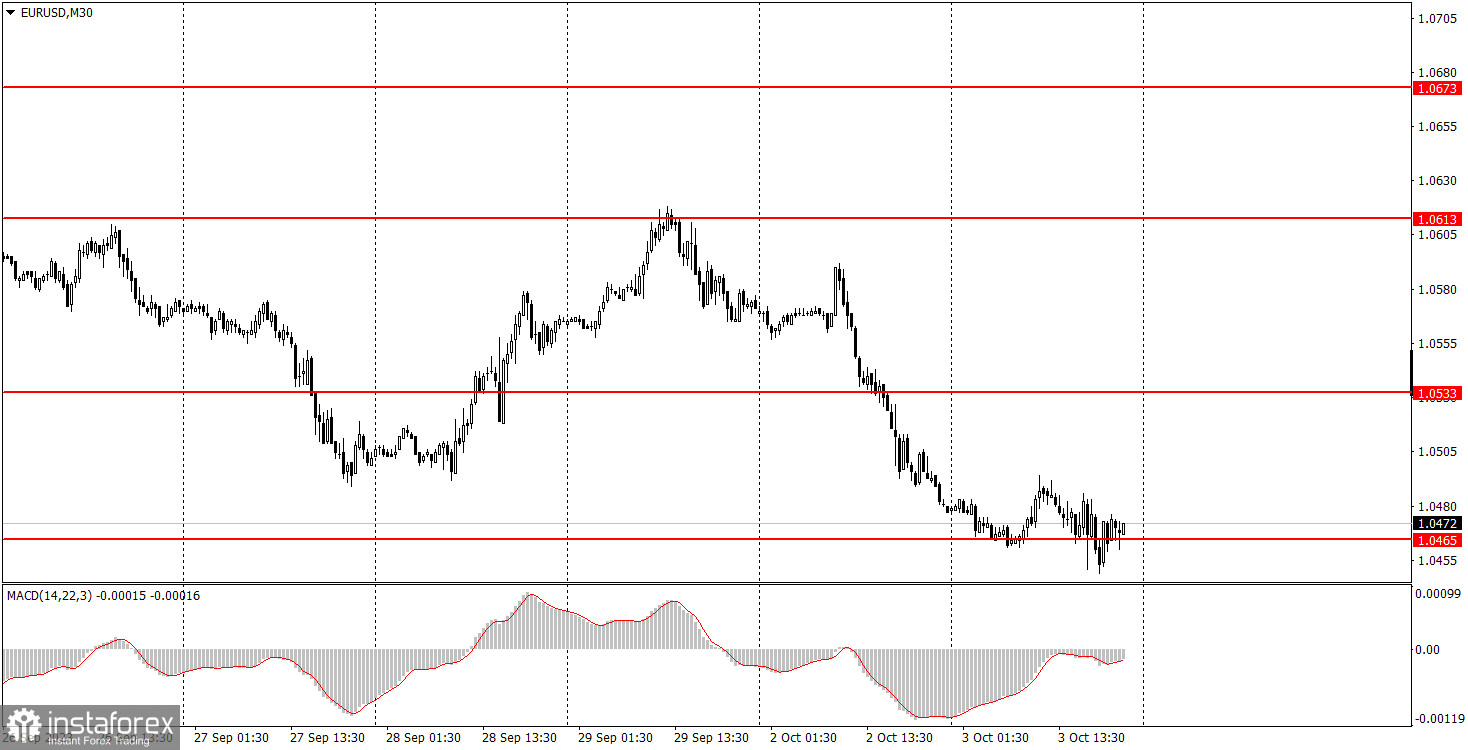
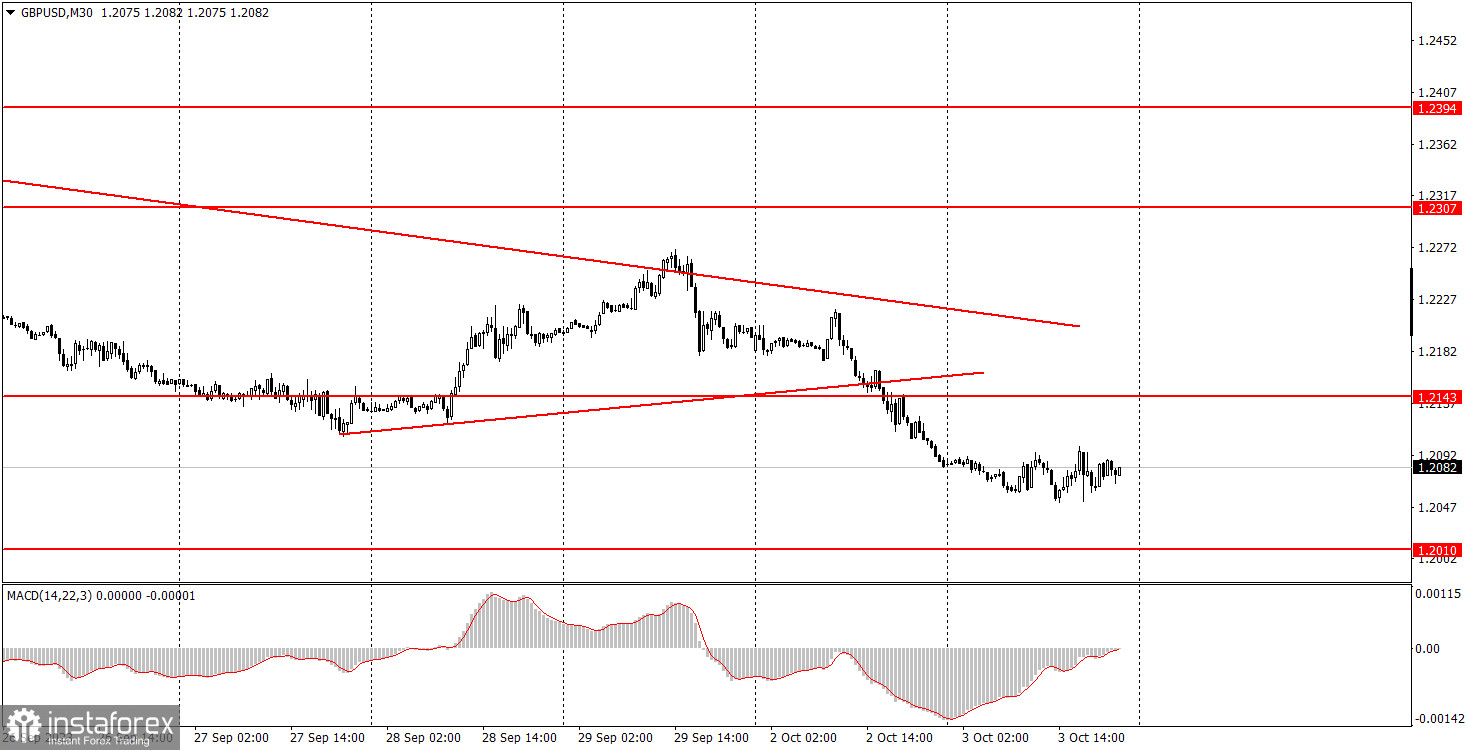
Support and Resistance price levels can serve as targets when buying or selling. You can place Take Profit levels near them.
Red lines represent channels or trend lines, depicting the current market trend and indicating the preferable trading direction.
The MACD(14,22,3) indicator, encompassing both the histogram and signal line, acts as an auxiliary tool and can also be used as a signal source.
Significant speeches and reports (always noted in the news calendar) can profoundly influence the price dynamics. Hence, trading during their release calls for heightened caution. It may be reasonable to exit the market to prevent abrupt price reversals against the prevailing trend.
Beginning traders should always remember that not every trade will yield profit. Establishing a clear strategy coupled with sound money management is the cornerstone of sustained trading success.


