


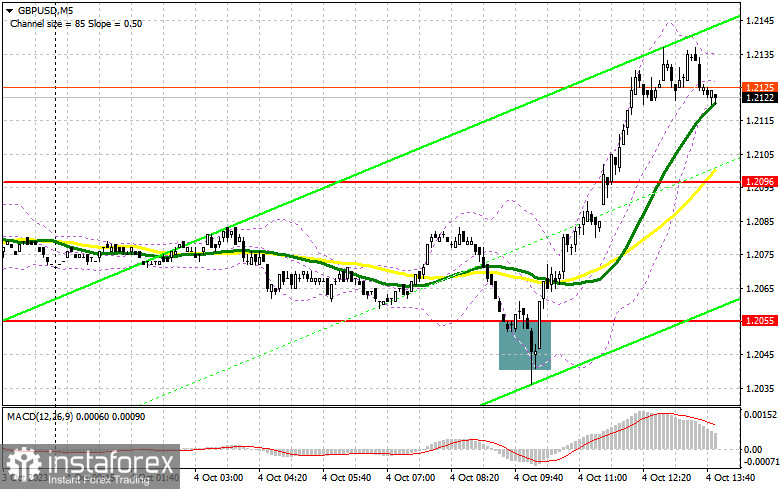
In my morning review, I mentioned the level of 1.2055 as a possible entry point. Let's have a look at what happened on the 5-minute chart. A decline to this level and its false breakout generated a good entry point into long positions, pushing the price up by more than 70 pips. sell signal in line with the bearish trend. For the second half of the day, the technical setup has been reviewed.
For long positions on GBP/USD:
Strong data on the UK services sector that rebounded to almost the 50-point mark allowed the GBP/USD buyers to return to the market, aiming for an upward correction. However, the further direction depends entirely on similar data on the US services sector from the ISM. Upbeat data combined with rising ADP employment statistics will boost the US dollar, thus bringing the pair down. If the pound is back under pressure, buyers will have to demonstrate their presence in the area of 1.2096 which is also the support level formed yesterday. A false breakout at his level will create a good entry point into long positions, aiming for a correction towards 1.2153. Breaking and settling above this range will bolster the buyers' confidence and generate the signal to open long positions with the target at 1.2216. The ultimate target will be the 1.2163 area where I will be looking to take profits. If the pair declines to 1.2096 without any buying activity in the second half of the day, bearish pressure on the pound will likely return and sellers will take over the market. In this case, only the protection of the new low of 1.2040 and its false breakout will signal a buying opportunity. I will buy GBP/USD immediately on a rebound from the low of 1.2012, aiming for a daily intraday correction of 30-35 pips.
For short positions on GBP/USD:
Bears received a serious blow from the buyers but this does not seem to have influenced the current setup. As soon as the data on the US labor market displays its resilience, the pressure on the pound will return, causing it to drop significantly lower. If the pair continues to rise in the afternoon trade, it is better to enter the market near the new resistance of 1.2153. A false breakout at this level will create a sell entry point, with a prospect of a further decline to 1.2096 where moving averages support the bulls. Breaking and retesting this level from below will deliver a serious blow to bullish positions, intensifying the bearish bias and paving the way for a steeper decline to the monthly low of 1.2040. The downward target is found at 1.2012 where I will be taking profit. If GBP/USD rises and bears show no activity at 1.2153, an upside correction will continue. In this case, I will delay going short at least until a false breakout at 1.2216 occurs. If there is no downward movement there, I will sell the pound immediately on a rebound from 1.2268, targeting an intraday correction of 30-35 pips.
COT report
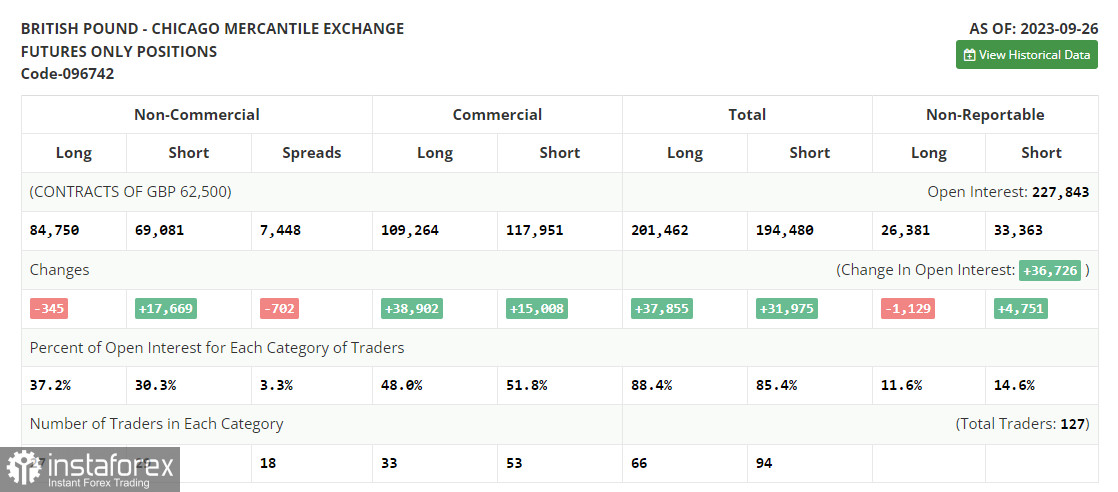
The Commitments of Traders report for September 26 indicated a reduction in long positions and a strong rise in the long ones. This suggests that the number of pound buyers is decreasing, especially after a batch of disappointing statistics reflecting weak economic growth in the UK. Considering that UK GDP may show even a sharper slowdown in the third quarter, it is not surprising why the pound is rapidly depreciating against the US dollar. The latest COT report states that long non-commercial positions fell by 345 to 84,750, while short non-commercial positions increased by 17,669 to 69,081. As a result, the spread between long and short positions narrowed by 702. The weekly closing price fell to 1.2162 from 1.2390.
Indicator signals:
Moving Averages
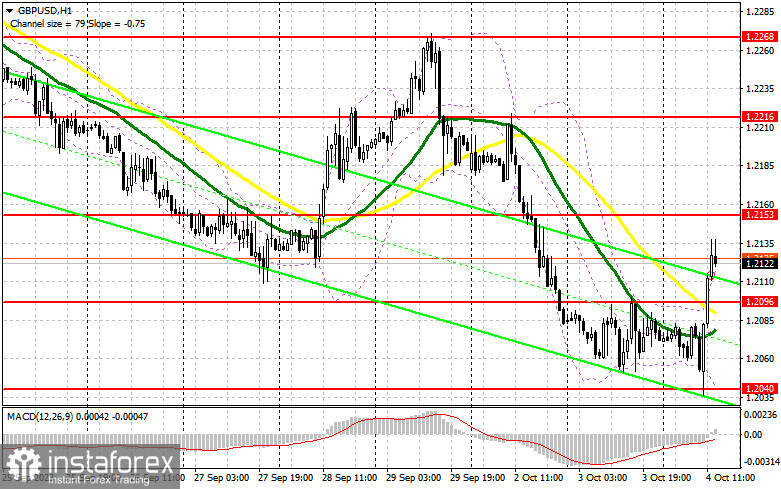
Trading above the 30- and 50-day moving averages indicates a slight bullish prevailance.
Please note that the time period and levels of the moving averages are analyzed only for the H1 chart, which differs from the general definition of the classic daily moving averages on the D1 chart.
Bollinger Bands
If the pair declines, the lower band of the indicator at 1.2040 will act as support.
Description of indicators:
• A moving average of a 50-day period determines the current trend by smoothing volatility and noise; marked in yellow on the chart;
• A moving average of a 30-day period determines the current trend by smoothing volatility and noise; marked in green on the chart;
• MACD Indicator (Moving Average Convergence/Divergence) Fast EMA with a 12-day period; Slow EMA with a 26-day period. SMA with a 9-day period;
• Bollinger Bands: 20-day period;
• Non-commercial traders are speculators such as individual traders, hedge funds, and large institutions who use the futures market for speculative purposes and meet certain requirements;
• Long non-commercial positions represent the total number of long positions opened by non-commercial traders;
• Short non-commercial positions represent the total number of short positions opened by non-commercial traders;
• The non-commercial net position is the difference between short and long positions of non-commercial traders.


