


Analysis of Wednesday trades:
GBP/USD 30M chart
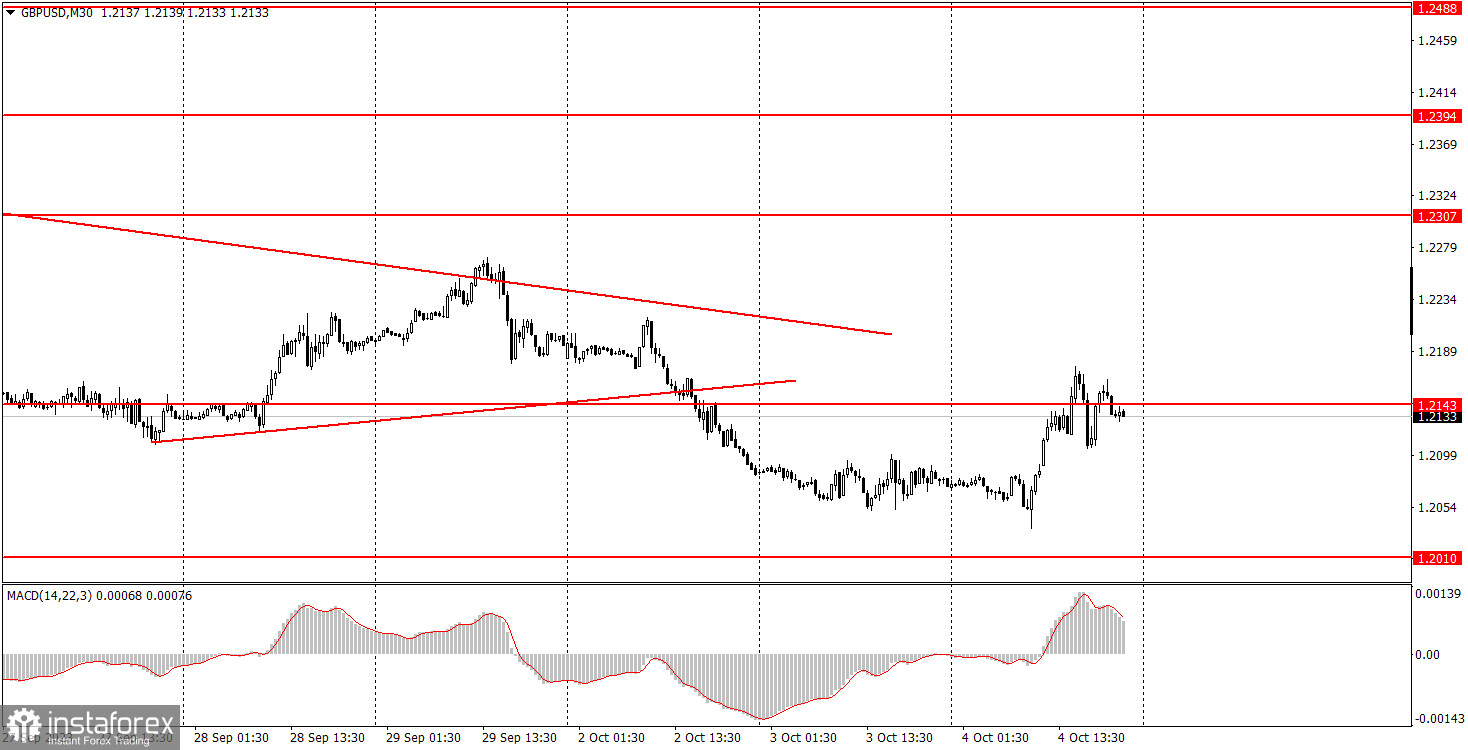
In the aftermath of the week's third trading day, the GBP/USD pair also displayed notably chaotic movements, particularly on the 5-minute time frame (TF). On the 30-minute TF, the pair initiated a new wave of upward correction, potentially presenting a more convincing and robust demeanor than its predecessor. It's worth noting that the British pound currently struggles to find grounds for appreciation, as the fundamental and macroeconomic backdrop has long been unfavorable. Moreover, we've long maintained that the British currency is overbought, thus should ideally head south. However, two months have elapsed, and the pound has slumped by 1000 points, suggesting a slight upward correction might be due.
Today, the UK published a report on business activity in the services sector for September. Its value was slightly below its predecessor but significantly above forecasts. Theoretically, this report could have spurred growth in the British currency in the first half of the day. In the latter half, the ADP report revealed an increase of 89,000 new employees in the private sector, half below forecasts, yet the ISM index somewhat lifted spirits, aligning with predictions.
GBP/USD 5M chart
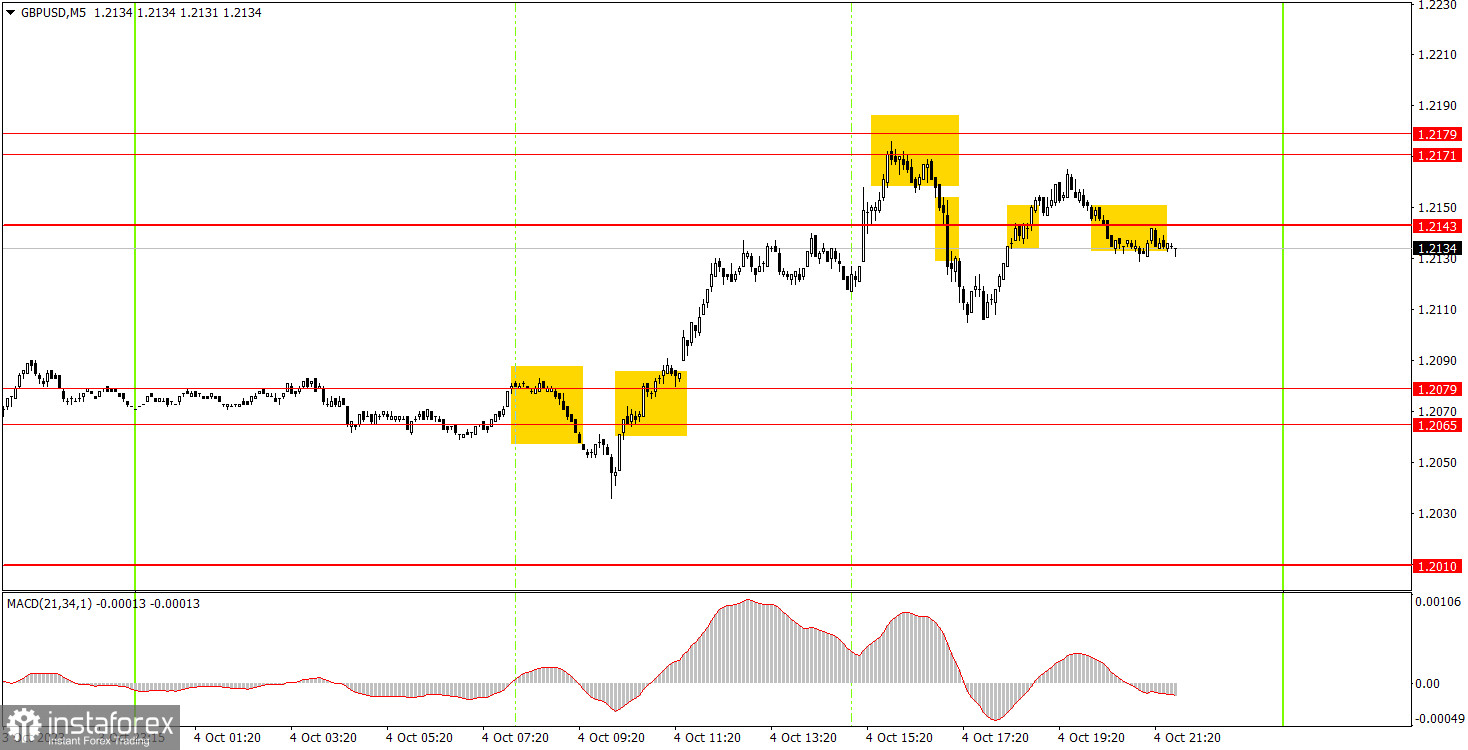
Wednesday saw the pair kick off the day by forming a false sell signal. A 20-point downward movement was not realized, resulting in a minor loss for novice traders on the initial trade. Subsequently, a buy signal around the same 1.2065-1.2079 area led to profit. The price ascended to the 1.2171-1.2179 zone, bouncing back from which long positions should have been closed, yielding a profit of approximately 55 points. A sell signal could have opened short positions, but traders were anticipating the ADP and ISM reports, the values of which were challenging to predict. It was safer to open at most one more trade. As soon as the price reversed upwards, it was prudent to exit the market.
Trading setup for Thursday:
On the 30-minute TF, the GBP/USD pair concluded its correction swiftly and may continue its downward trajectory. However, we believe that the pound may initiate a new wave of upward correction, even without specific daily fundamental and macroeconomic bases. A decline in the medium-term perspective is anticipated regardless, given the pound's prolonged and unjustified rise, but a correction now seems more logical. On the 5-minute TF, the key levels for tomorrow may be found at 1.1992-1.2010, 1.2052, 1.2107, 1.2171-1.2179, 1.2235, 1.2307, 1.2372-1.2394, 1.2457-1.2488, 1.2544, 1.2605-1.2620, 1.2653, and 1.2688. Once the price moves 20 points in the right direction post-trade opening, setting a Stop Loss to break-even is advisable. Thursday brings virtually no significant events in the UK and the US, save for the weekly unemployment claims report. Volatility may decrease, but movements will be less jagged.
Basic rules of a trading system:
1) Signal strength is determined by the time taken for its formation (either a bounce or level breach). A shorter formation time indicates a stronger signal.
2) If two or more trades around a certain level are initiated based on false signals, subsequent signals from that level should be disregarded.
3) In a flat market, any currency pair can produce multiple false signals or none at all. In any case, the flat trend is not the best condition for trading.
4) Trading activities are confined between the onset of the European session and mid-way through the U.S. session, post which all open trades should be manually closed.
5) On the 30-minute timeframe, trades based on MACD signals are only advisable amidst substantial volatility and an established trend, confirmed either by a trend line or trend channel.
6) If two levels lie closely together (ranging from 5 to 15 pips apart), they should be considered as a support or resistance zone
How to read charts:
Support and Resistance price levels can serve as targets when buying or selling. You can place Take Profit levels near them.
Red lines represent channels or trend lines, depicting the current market trend and indicating the preferable trading direction.
The MACD(14,22,3) indicator, encompassing both the histogram and signal line, acts as an auxiliary tool and can also be used as a signal source.
Significant speeches and reports (always noted in the news calendar) can profoundly influence the price dynamics. Hence, trading during their release calls for heightened caution. It may be reasonable to exit the market to prevent abrupt price reversals against the prevailing trend.
Beginning traders should always remember that not every trade will yield profit. Establishing a clear strategy coupled with sound money management is the cornerstone of sustained trading success.


