


The euro continues to hold positive ground, mainly due to the dollar's excessive overbought condition. Changes in the number of initial jobless claims in the United States turned out to be even more modest than expected. Initial claims for state unemployment benefits increased 2,000, against a forecast of 5,000. Continuing claims slipped by 1,000 instead of remaining unchanged.
Today, the dollar may continue to weaken if forecasts regarding the content of the US Department of Labor report are confirmed. In the first place, this concerns the number of new non-farm jobs created. It should be something around 150,000. Take note that in order to maintain labor market stability, an average of more than 200,000 new jobs should be created a month. About 250,000 per month, to be precise. Yes, there can be fewer jobs, but there should be more in the next month. So, if the current forecast is confirmed, it will mean that fewer than 200,000 new jobs have been created for the fourth consecutive month. In fact, except for May, when 281,000 new jobs were created, not enough jobs have been created since March. This raises questions about the adequacy of the current unemployment data, which should clearly start to rise. Therefore, if the forecast is confirmed, the dollar will continue to lose ground.
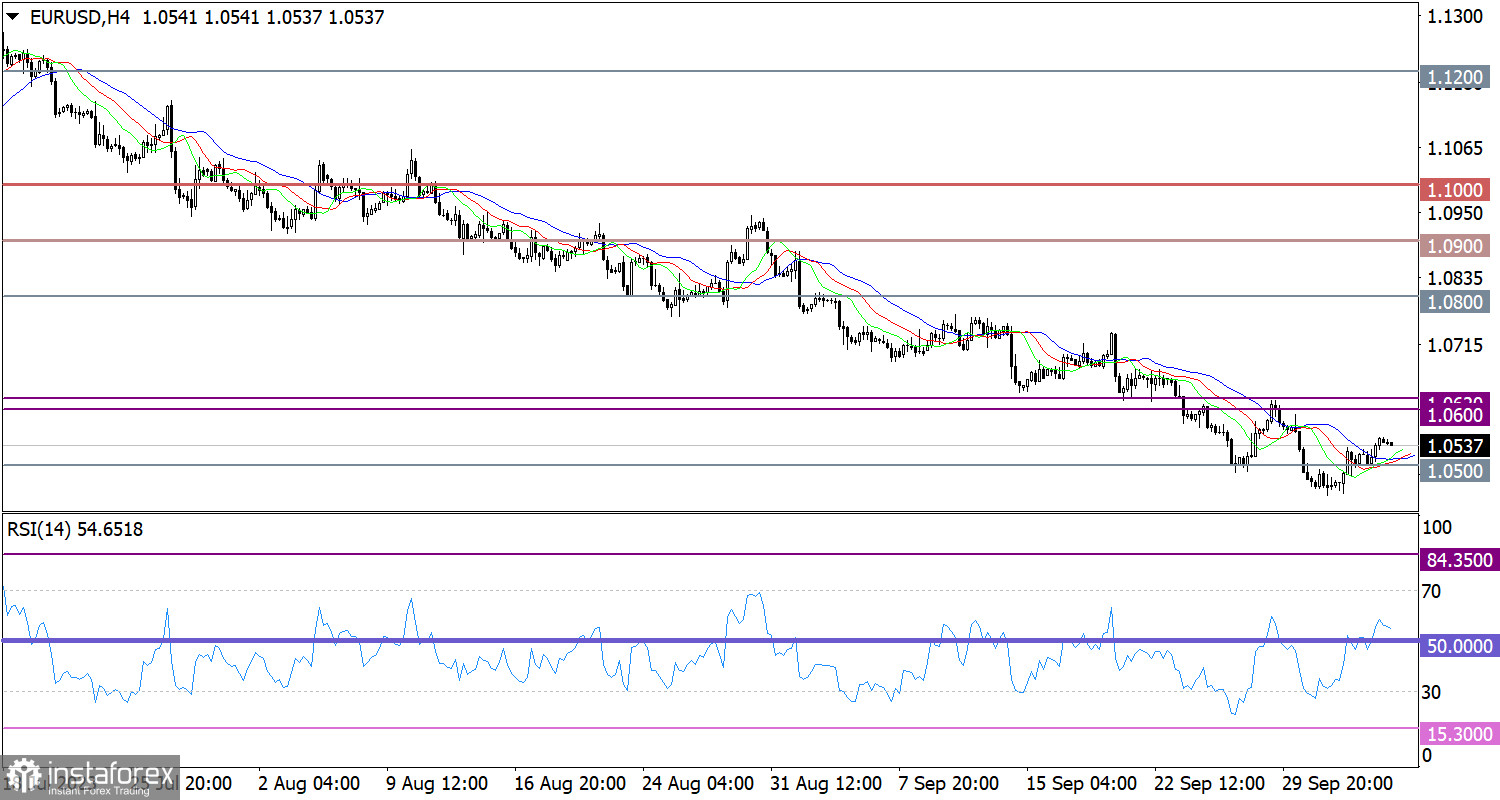
The EUR/USD pair has strengthened by about 100 pips during the corrective phase. However, this is not enough to change the market bias. Since mid-July, the euro has lost about 7% of its value, which is approximately 800 pips.
On the four-hour chart, the RSI crossed the 50 middle line. As a result, the volume of long positions increased during the corrective phase.
On the same timeframe, the Alligator's MAs confirm the current phase by changing direction.
Outlook
The bullish scenario suggests that the price could move towards 1.0600-1.0620. The bearish scenario will come into play in case the price returns below the level of 1.0500. In this case, the volume of short positions should increase, and a new local low will be formed.
Complex indicator analysis indicates a corrective phase in the short-term and intraday periods. Meanwhile, in the mid-term period, the indicators are reflecting a downward cycle.


