


Trend analysis (Fig. 1).
The GBP/USD currency pair may move downward from the level of 1.2187 (closing of yesterday's daily candle) to 1.2155, the 5-period EMA (red thin line). In the case of testing this level, an upward movement is possible with a target of 1.2272, the 21-period EMA (black thin line).
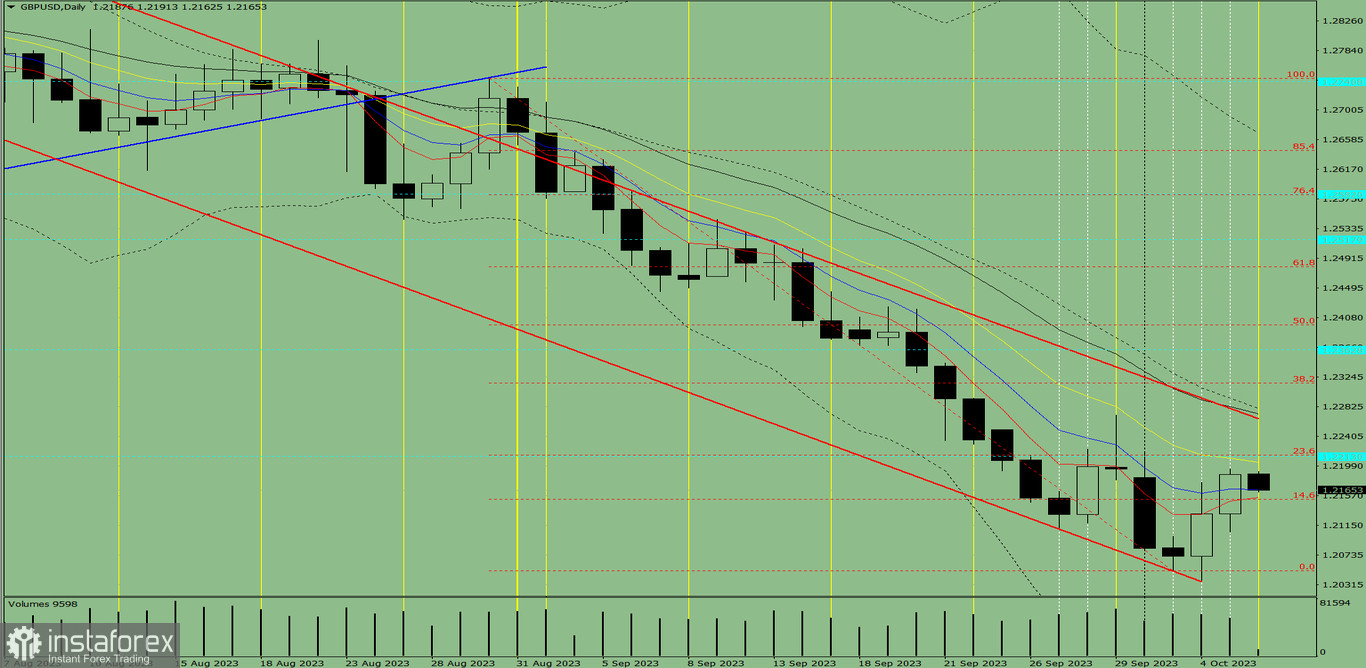
Fig. 1 (daily chart).
Comprehensive analysis:
- Indicator analysis – up;
- Fibonacci levels – up;
- Volumes – up;
- Candlestick analysis – up;
- Trend analysis – up;
- Bollinger bands – down;
- Weekly chart – up.
General conclusion: Today, the price may move downward from the level of 1.2187 (closing of yesterday's daily candle) to 1.2155, the 5-period EMA (red thin line). In the case of testing this level, an upward movement is possible with a target of 1.2272, the 21-period EMA (black thin line).
Alternatively, the price may move downward from the level of 1.2187 (closing of yesterday's daily candle) to 1.2152, the 14.6% pullback level (red dotted line). Upon reaching this level, an upward movement is possible with a target of 1.2272, the 21-period EMA (black thin line).


