


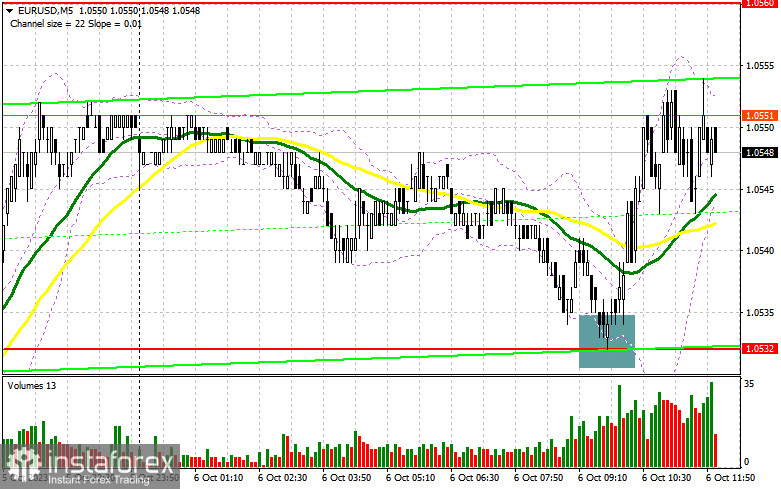
In my morning forecast, I drew attention to the level of 1.0532 and recommended making entry decisions based on it. Let's take a look at the 5-minute chart and analyze what happened there. The drop and the formation of a false breakout at this level resulted in a buy signal for the euro, which translated into an upward movement of only 20 pips. In the second half of the day, the technical picture remained unchanged.
To open long positions on EUR/USD, the following is required:
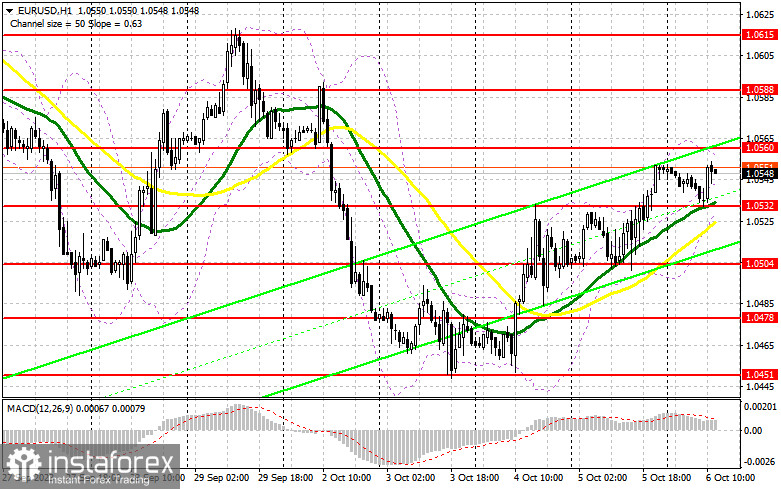
Ahead of us, there is data on changes in non-farm payrolls in the US. These data have a significant impact on the Federal Reserve's policy, so if we see a sharp reduction in new non-farm jobs, similar to what happened in the private sector, whose report was released this Wednesday, then most likely, pressure on the dollar will increase, and risk assets will have a chance to continue their upward correction. If the report matches or exceeds forecasts, the dollar will attempt to regain its advantages, leading to a decline in the pair. In this case, I will act according to the morning scenario. A drop and the formation of a false breakout at 1.0532, similar to what I discussed earlier, will provide a good entry point for long positions, with the expectation of further upward correction of the pair towards the resistance at 1.0560, which was not reached yesterday. A breakthrough and a top-down test of this range against the backdrop of weak statistics will give a chance for a surge to 1.0588. The ultimate target will be the area around 1.0615, where I will make profits. In the event of a decline in EUR/USD and no activity at 1.0532 in the second half of the day, the pressure on the euro will return, but it is too early to talk about the resumption of a bearish market. In this case, only the formation of a false breakout around 1.0504 will signal an entry into the market. I will open long positions on a bounce from 1.0478 with the target of an upward correction of 30-35 points within the day.
To open short positions on EUR/USD, the following is required:
Sellers tried, but it didn't work out very well. Only the defense of the nearest resistance at 1.0560 and the formation of a false breakout there, along with strong data on the US labor market, will provide a signal to sell the euro with a downward movement to the support at 1.0532. I do not anticipate receiving another sell signal with a target at the minimum of 1.0504, which large buyers repeatedly successfully defended yesterday, until after breaking and consolidating below this range as well as a bottom-up retest. The ultimate target will be the area around 1.0478, where I will make profits. In the event of an upward movement of EUR/USD during the American session and the absence of bears at 1.0560, which is likely to happen, buyers will have a chance for further upward corrections. In this case, I will postpone short positions until the resistance reaches 1.0588. Selling can be considered, but only after an unsuccessful consolidation. I will open short positions immediately on a bounce from 1.0615 with the target of a downward correction of 30-35 points.
Indicator Signals:
Moving averages
Trading is taking place above the 30-day and 50-day moving averages, indicating an attempt by bulls to establish an upward correction in the pair.
Note: The period and prices of the moving averages mentioned by the author are considered on the hourly chart (H1) and differ from the general definition of classical daily moving averages on the daily chart (D1).
Bollinger Bands
In the case of a decline, the lower boundary of the indicator around 1.0530 will act as support.
Description of indicators:
• Moving Average (determines the current trend by smoothing volatility and noise). Period 50. Marked in yellow on the chart.
• Moving Average (determines the current trend by smoothing volatility and noise). Period 30. Marked in green on the chart.
• MACD Indicator (Moving Average Convergence/Divergence – convergence/divergence of moving averages) Fast EMA period 12. Slow EMA period 26. SMA period 9.
• Bollinger Bands (Bollinger Bands). Period 20.
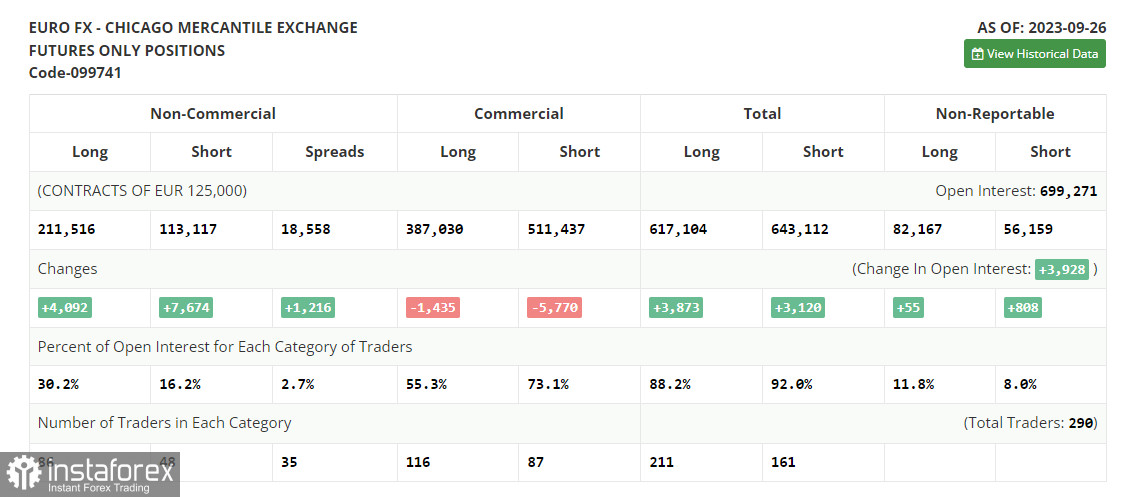
• Non-commercial traders - speculators, such as individual traders, hedge funds, and large institutions, using the futures market for speculative purposes and meeting specific requirements.
• Long non-commercial positions represent the total long open position of non-commercial traders.
• Short non-commercial positions represent the total short open position of non-commercial traders.
• The total non-commercial net position is the difference between the short and long positions of non-commercial traders.


