


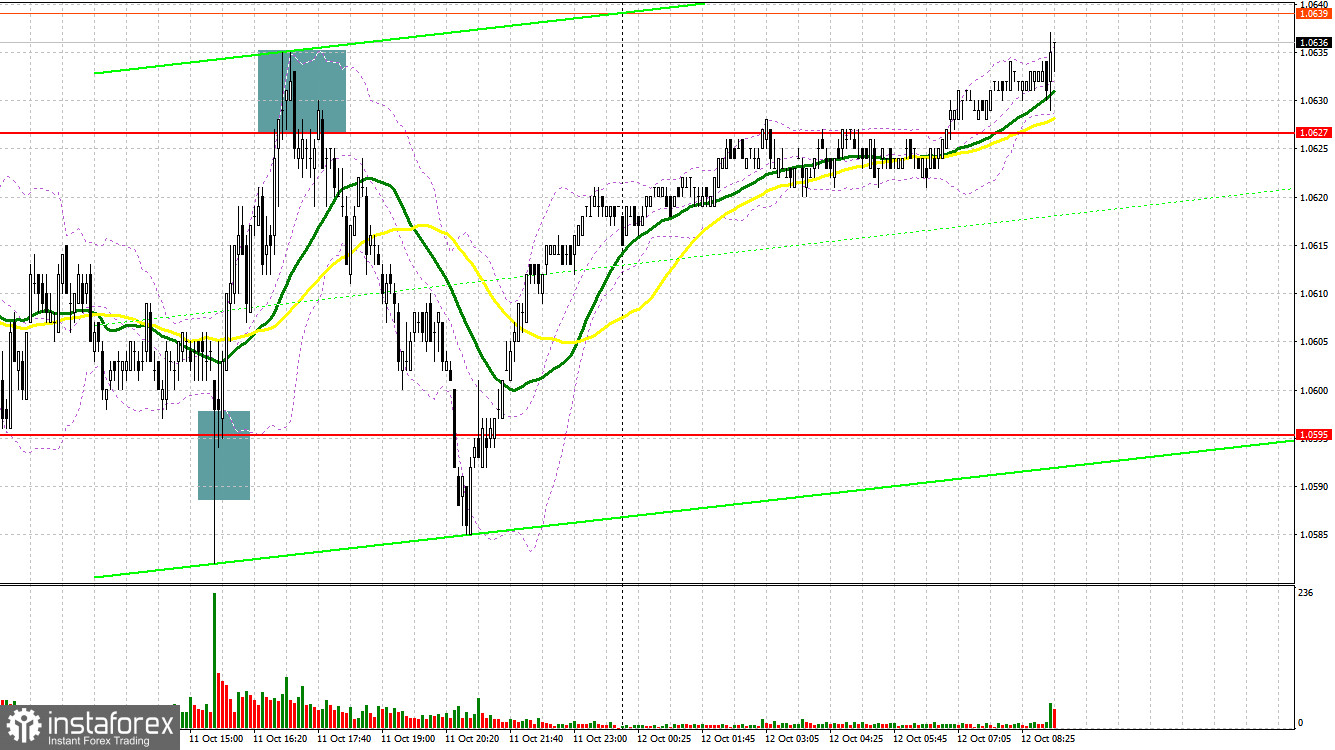
Yesterday, the pair formed several signals to enter the market. Let's have a look at what happened on the 5-minute chart. In my morning review, I mentioned the level of 1.0616 as a possible entry point. A rise to this level and its false breakout in the first half of the day generated a good entry point into short positions, sending the pair down by more than 20 pips. In the afternoon, bullish activity at the new support of 1.0595 formed a buy signal and prompted a surge of 30 pips. After that, sellers stepped into the market at 1.0627 and generated a sell signal, pushing EUR/USD down by 40 pips.
For long positions on EUR/USD
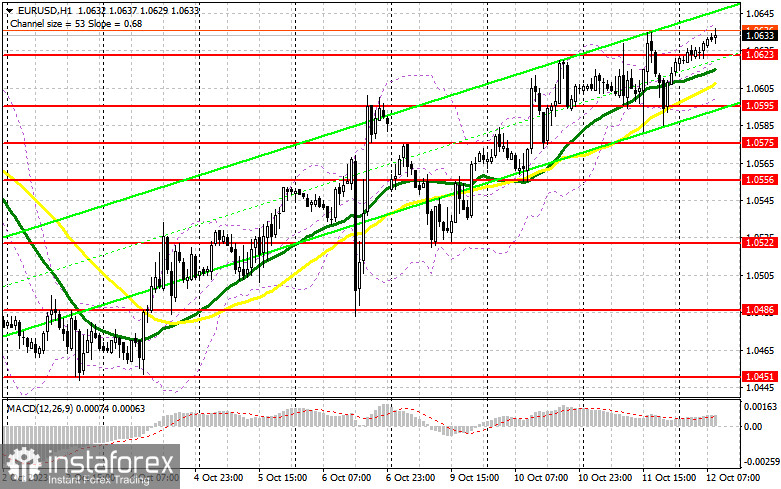
Dovish Fed minutes caused a surge in volatility, but as we can see on the chart, traders continue to buy risk assets, including the euro. They obviously hope that major central banks will soon pause their tightening cycles. In the first half of the day on Thursday, the ECB publishes a report on the latest meeting, which can potentially support the euro. In addition, Frank Elderson, the Member of the Executive Board of the ECB, will also deliver a speech today. However, the highlight of today's session will be the inflation report in the US which we will discuss in the second half of the day. In the European session, I will act on a decline after a false breakout at the new support of 1.0623 that was formed yesterday. This will create a good entry point into long positions with the aim of developing a bullish market. The upside target will be the resistance of 1.0651 where I expected the sellers to show their presence. Breaking and testing this range from above will provide an opportunity for a surge towards 1.0704. The ultimate target will be the 1.0734 area where I intend to take profits. If EUR/USD declines and there is no buying activity at 1.0623 in the first half of the day, the pressure on the euro will increase, bringing the pair into the sideways channel. In this case, only a false breakout near 1.0595, above which moving averages are located, will signal a buying opportunity. I will open long positions immediately on a rebound from 1.0575, aiming for an upward intraday correction of 30-35 pips.
For short positions on EUR/USD
Every time the euro rises, bears assert their strength more vigorously. A reversal in the current bullish trend can only be possible after the release of the US inflation data as no other report is capable of doing this. Maintaining a strong presence at the nearest resistance of 1.0651 is the priority task for bears right now. If they lose this level, the bearish trend will be canceled. Only a false breakout at this point during the ECB minutes release will generate a sell signal, with a prospect of a decline towards the 1.0623 support, below which moving averages support the buyers. If bears are determined to stop the correction, they need to seize control over this level. A breakout and consolidation below this range, as well as its upward retest, will give another sell signal with the target at the low of 1.0595. The ultimate target will be the 1.0575 level where I will take profits. If EUR/USD rises during the European session and bears are absent at 1.0651, which is possible amid dovish ECB minutes, bulls might get a chance to develop an uptrend. In this scenario, I will delay going short until the price hits the resistance at 1.0671. I may consider selling there but only after a failed consolidation. I will go short immediately on a rebound from the high of 1.0704, aiming for a downward correction of 30-35 pips.
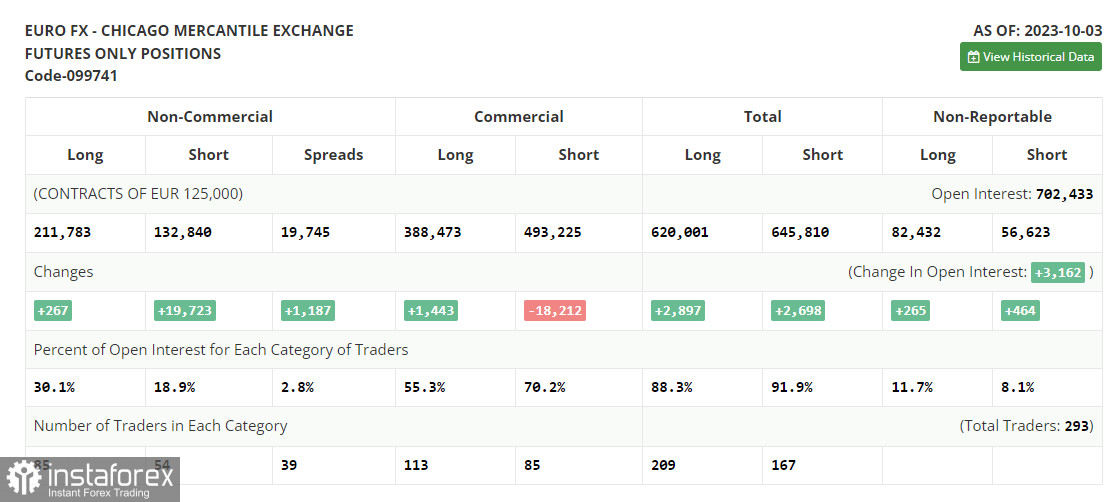
COT report
The Commitments of Traders report for October 3 recorded a minimal rise in long positions and a sharp increase in short positions. Apparently, after the central banks' meetings, markets realized that interest rates will be raised further in the fight against inflation. This will definitely drive the US dollar higher which is already reflected in the COT reports. Notably, these reports have not yet factored in the changes caused by the recent US jobs data which twice exceeded the forecast. In addition, the military conflict in the Middle East also undermines risk sentiment, thus spurring demand for safe-haven assets such as the US dollar. The COT report indicates that non-commercial long positions went up by just 267 to stand at 211,783, while non-commercial short positions jumped by 19,723, reaching a total of 132,840. As a result, the spread between long and short positions increased by 1,187. The closing price dropped to 1.0509 from 1.0604, further underscoring the bearish market sentiment.
Indicator signals:
Moving Averages
Trading above the 30- and 50-day moving averages indicates that buyers are trying to continue correction.
Please note that the time period and levels of the moving averages are analyzed only for the H1 chart, which differs from the general definition of the classic daily moving averages on the D1 chart.
Bollinger Bands
If the pair declines, the lower band of the indicator at 1.0595 will act as support.
Description of indicators:
• A moving average of a 50-day period determines the current trend by smoothing volatility and noise; marked in yellow on the chart;
• A moving average of a 30-day period determines the current trend by smoothing volatility and noise; marked in green on the chart;
• MACD Indicator (Moving Average Convergence/Divergence) Fast EMA with a 12-day period; Slow EMA with a 26-day period. SMA with a 9-day period;
• Bollinger Bands: 20-day period;
• Non-commercial traders are speculators such as individual traders, hedge funds, and large institutions who use the futures market for speculative purposes and meet certain requirements;
• Long non-commercial positions represent the total number of long positions opened by non-commercial traders;
• Short non-commercial positions represent the total number of short positions opened by non-commercial traders;
• The non-commercial net position is the difference between short and long positions of non-commercial traders.


