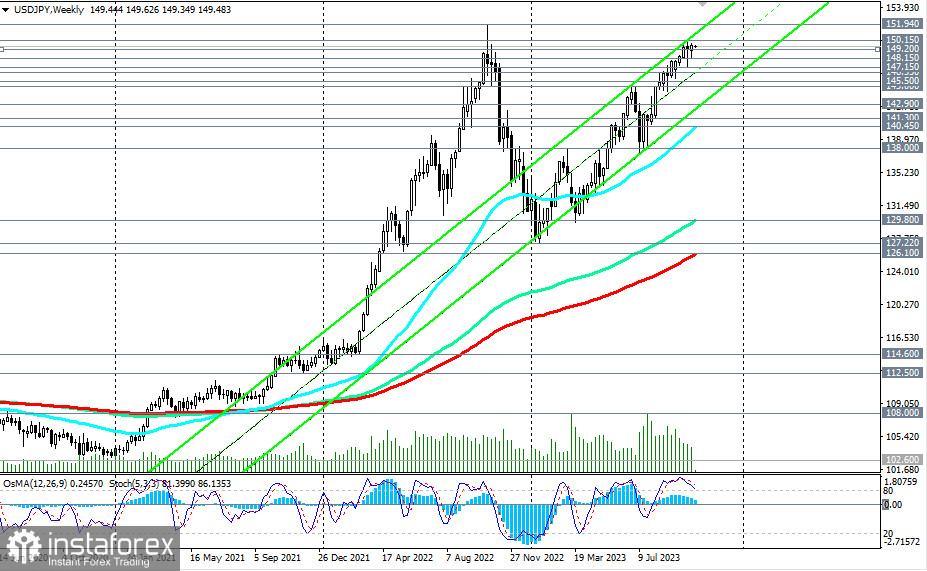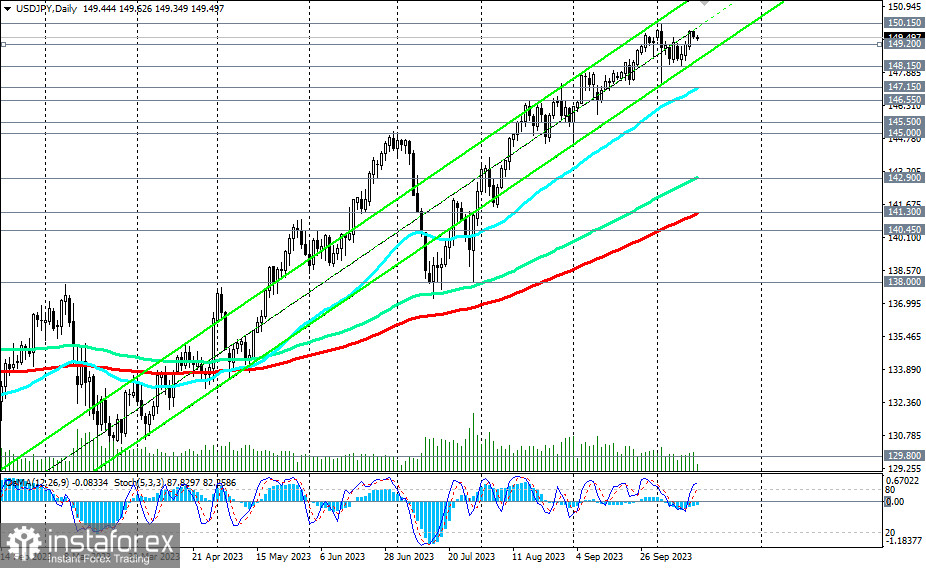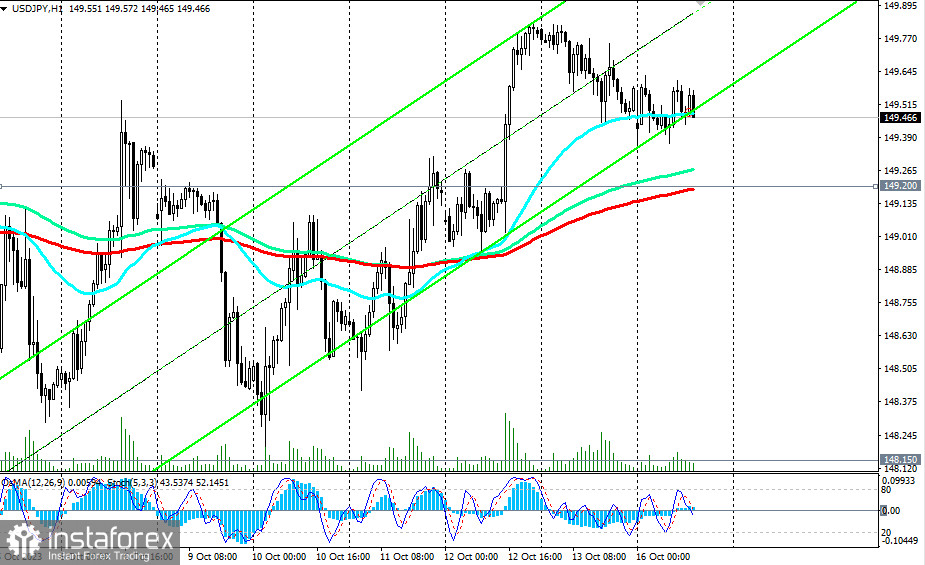
As of the beginning of the new trading week on October 16, the USD/JPY currency pair continues to trade within the zone of a stable bullish market, with short-term support levels at 149.20 (200 EMA on the 1-hour chart) and 148.00 (200 EMA on the 4-hour chart), medium-term support levels at 142.90 (144 EMA on the daily chart) and 141.30 (200 EMA on the daily chart), and long-term support levels at 129.80 (144 EMA on the weekly chart) and 126.10 (200 EMA on the weekly chart).
At the same time, investors are cautious about building long positions because the pair's quotes are in close proximity to the psychological level of 150.00.

Previously, market participants considered the level of 145.00 to be a "protective" level at which the Bank of Japan would conduct a currency intervention. However, at the moment, the USD/JPY is already trading near the 150.00 level, and investors assume that the Bank of Japan will "defend" this level of 150.00.
Thus, as we can see, USD/JPY has been trading in a range between 150.15 and 148.15 since the beginning of the month, with a conditional midline passing through the 149.20 level, which in turn is an important short-term support level.

We also assume that new drivers are needed to break this range in one direction or another. These could be important geopolitical or economic news or active actions by the Fed or the Bank of Japan on monetary policy matters.
Accordingly, a confident breakout of the 150.15 level can reassure buyers of the pair, allowing them to increase their long positions.
On the other hand, a break below the 148.00 level could mark the beginning of an alternative scenario for the pair's decline.
If the downward correction does not stop near the support levels of 147.15 (50 EMA on the daily chart) and 146.55 (local support level), USD/JPY risks further decline, down to key support levels at 142.90 and 141.30.
A break of the support levels of 140.45 (50 EMA on the weekly chart) and 140.00 would lead the pair into the medium-term bearish market zone (while maintaining the long-term and global bullish markets).
Support levels: 149.20, 149.00, 148.15, 148.00, 147.15, 147.00, 146.55, 145.50, 145.00, 142.90, 142.00, 141.30, 141.00, 140.45
Resistance levels: 150.00, 150.15, 151.00, 152.00


