


Analyzing Wednesday's trades:
EUR/USD on 30M chart
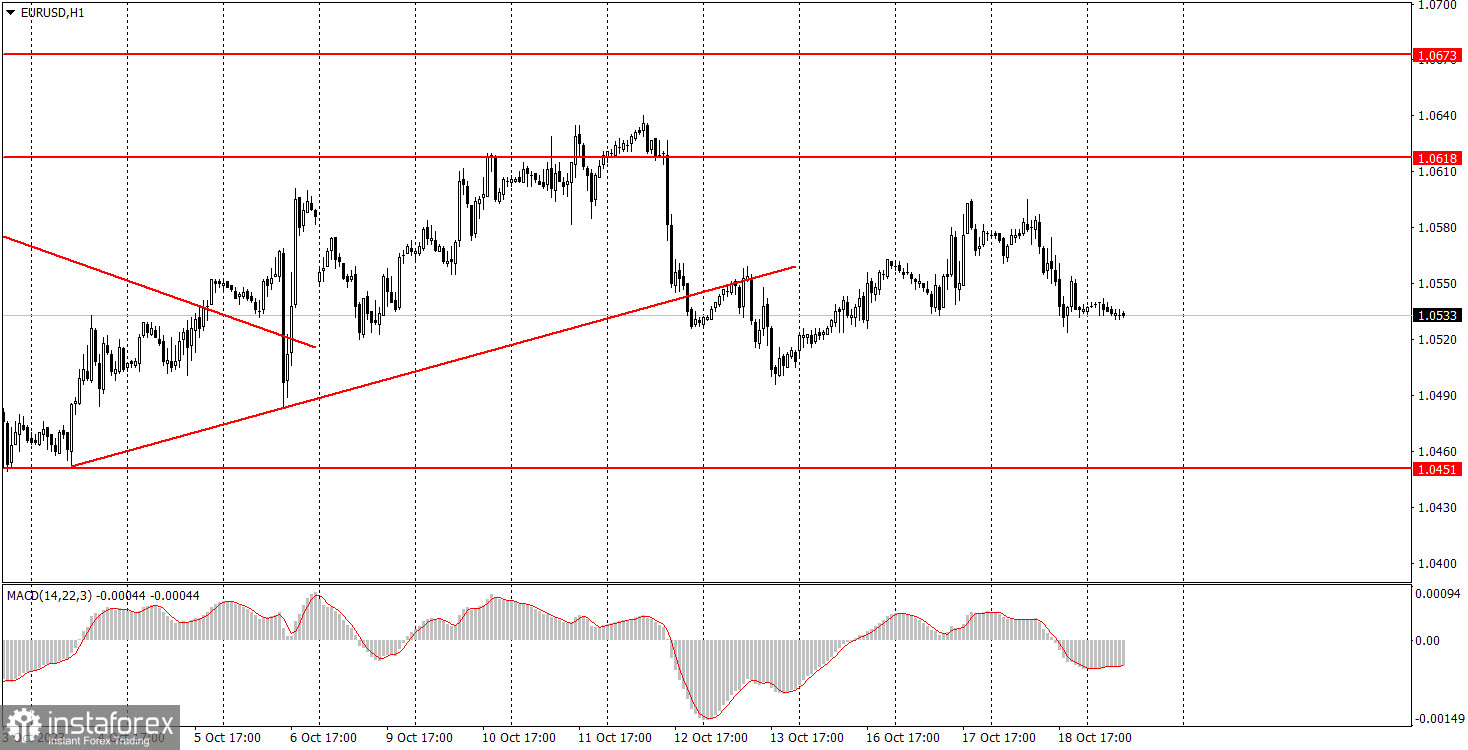
EUR/USD traded lower on Wednesday. The current movements are quite chaotic. The problem is that we don't know which direction the pair is heading. Traders are ignoring several levels and important lines, making it impossible to draw any conclusions. Trendlines aren't working, and the Ichimoku indicator isn't working either. Therefore, we believe that this is not the most favorable time to trade. The 5-minute chart clearly shows that the movements are erratic, and the price frequently changes direction, leading to retracements. There is no distinct trend.
The macroeconomic background is not helping either. Most of the data are weak, and the reports that previously triggered strong movements can no longer set a trend. Yesterday, traders brushed off reports on EU inflation and US building permits. While these aren't the most important data, what's peculiar is that the market also ignored the UK inflation report, which was genuinely significant.
EUR/USD on 5M chart
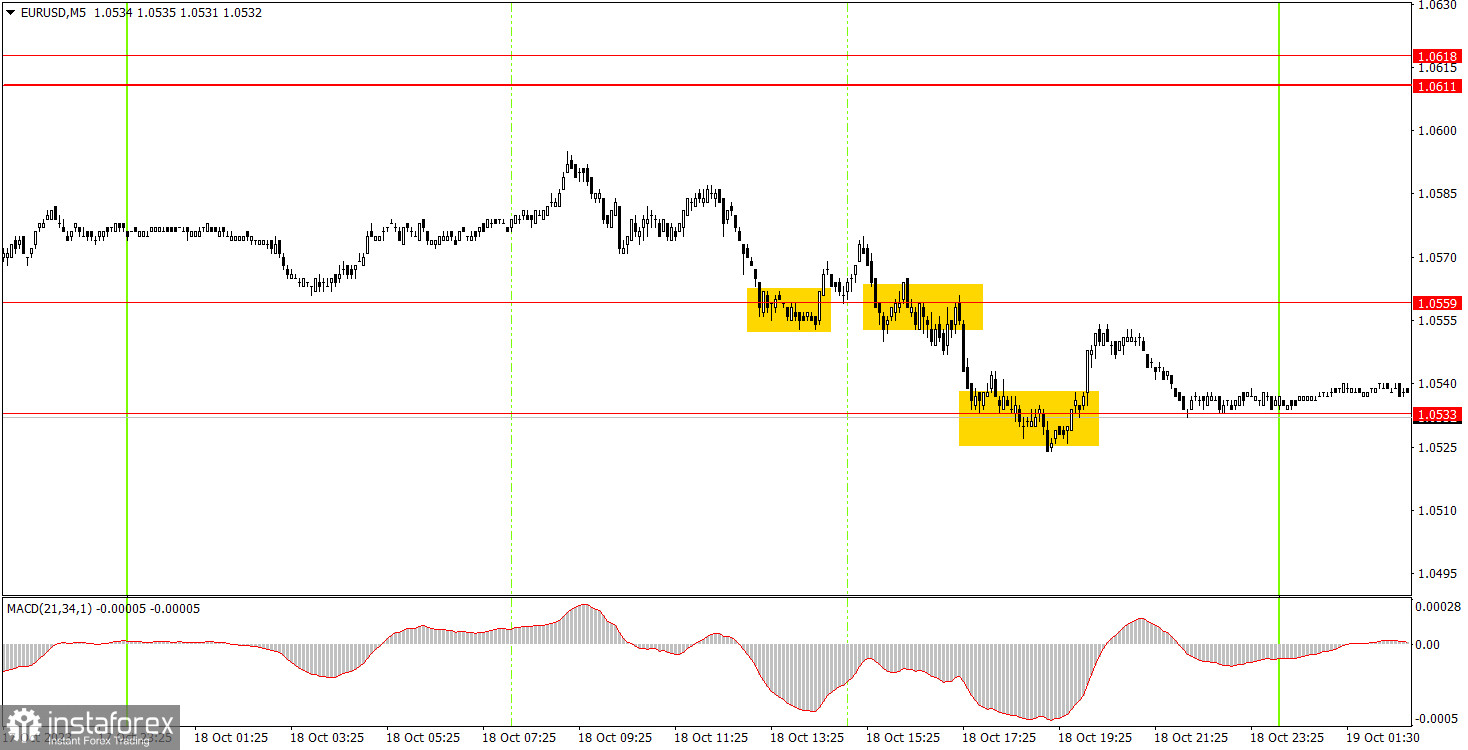
Several trading signals were formed on the 5-minute chart, but they were all weak and frankly, bad. Trading between the levels of 1.0533 and 1.0559 should have been avoided altogether; the bounce from the level of 1.0559 (the first signal) turned out to be false. Therefore, it was best not to enter the market. It's not the easiest or most obvious decision, but we'll reiterate: it's important for you to be extremely cautious with any signals and trades at this time.
Trading tips on Thursday:
On the 30-minute chart, the pair has shown a sharp decline, potentially marking the onset of a full-fledged downtrend. We've consistently articulated our anticipation of a decline in the euro over the medium term. However, we were also factoring in a more pronounced pair correction. Our expectation was that this week would see the start of a new trend phase, but we can't determine whether the current movements are part of a correction or a trend. The key levels on the 5M chart are 1.0391, 1.0433, 1.0451, 1.0483, 1.0533, 1.0559, 1.0611-1.0618, 1.0673, 1.0733, 1.0767-1.0781, 1.0835. A stop loss can be set at a breakeven point as soon as the price moves 15 pips in the right direction. On Thursday, there are no significant events lined up in the European Union. From the U.S., we can look forward to Federal Reserve Chairman Jerome Powell's speech and two secondary reports. At this point, we don't think Powell's speech can particularly move the market, nonetheless, you should still be prepared for potential sharp movements during his speech.
Basic trading rules:
1) Signal strength is determined by the time taken for its formation (either a bounce or level breach). A shorter formation time indicates a stronger signal.
2) If two or more trades around a certain level are initiated based on false signals, subsequent signals from that level should be disregarded.
3) In a flat market, any currency pair can produce multiple false signals or none at all. In any case, the flat trend is not the best condition for trading.
4) Trading activities are confined between the onset of the European session and mid-way through the U.S. session, post which all open trades should be manually closed.
5) On the 30-minute timeframe, trades based on MACD signals are only advisable amidst substantial volatility and an established trend, confirmed either by a trend line or trend channel.
6) If two levels lie closely together (ranging from 5 to 15 pips apart), they should be considered as a support or resistance zone.
How to read charts:
Support and Resistance price levels can serve as targets when buying or selling. You can place Take Profit levels near them.
Red lines represent channels or trend lines, depicting the current market trend and indicating the preferable trading direction.
The MACD(14,22,3) indicator, encompassing both the histogram and signal line, acts as an auxiliary tool and can also be used as a signal source.
Significant speeches and reports (always noted in the news calendar) can profoundly influence the price dynamics. Hence, trading during their release calls for heightened caution. It may be reasonable to exit the market to prevent abrupt price reversals against the prevailing trend.
Beginning traders should always remember that not every trade will yield profit. Establishing a clear strategy coupled with sound money management is the cornerstone of sustained trading success.


